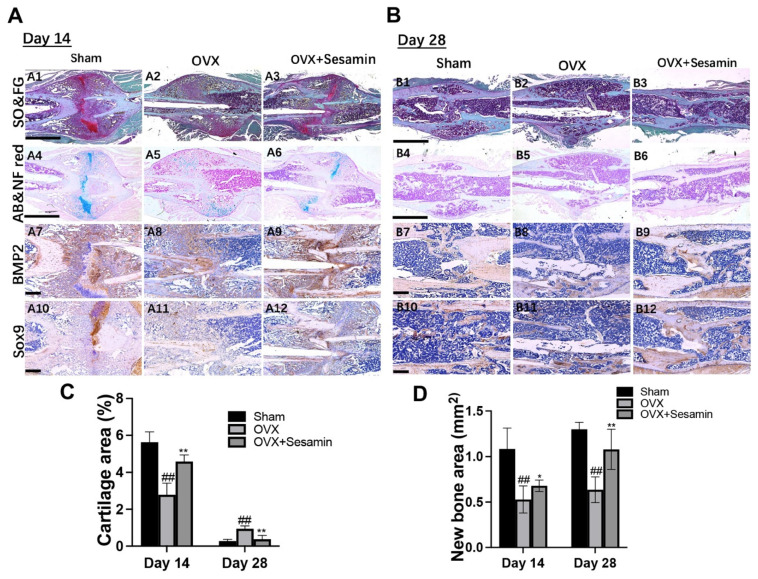
Figure 5.
Histological analysis of osteoporosis fracture healing upon sesamin treatment in vivo. (A,B) Safranin O/fast green (SO and FG) and alcian blue/nuclear fast red (AB/NF red) staining of femur fracture sites 14 (A1–A6) and 28 days (B1–B6) after surgery. IHC staining of femur fracture sites using BMP2 and SOX9 antibodies at day 14 (A7–A12) and day 28 (B7–B12) post-surgery. (C) Semi-quantitative analysis of cartilage area of each group at different timepoints after fracture. (D) Semi-quantitative analysis of newly formed sponge bone area in each group (n = 6; ## p < 0.01 vs. Sham group; * p < 0.05, ** p < 0.01 vs. OVX group).

