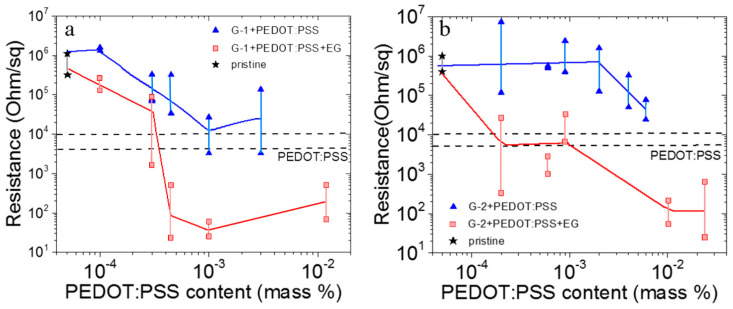
Figure 3.
Sheet resistance for composite graphene with PEDOT:PSS (blue points) and graphene, PEDOT:PSS and ethylene glycol (30 vol.%) (red points). Dash lines correspond to PEDOT:PSS films with different thicknesses. (a) G-1 (b) G-2. Black stars give the resistance values for pure graphene G-1 and G-2. Fluctuation in the sheet resistance connected with a strong (2–3 times) variation of the film thickness created by drops.

