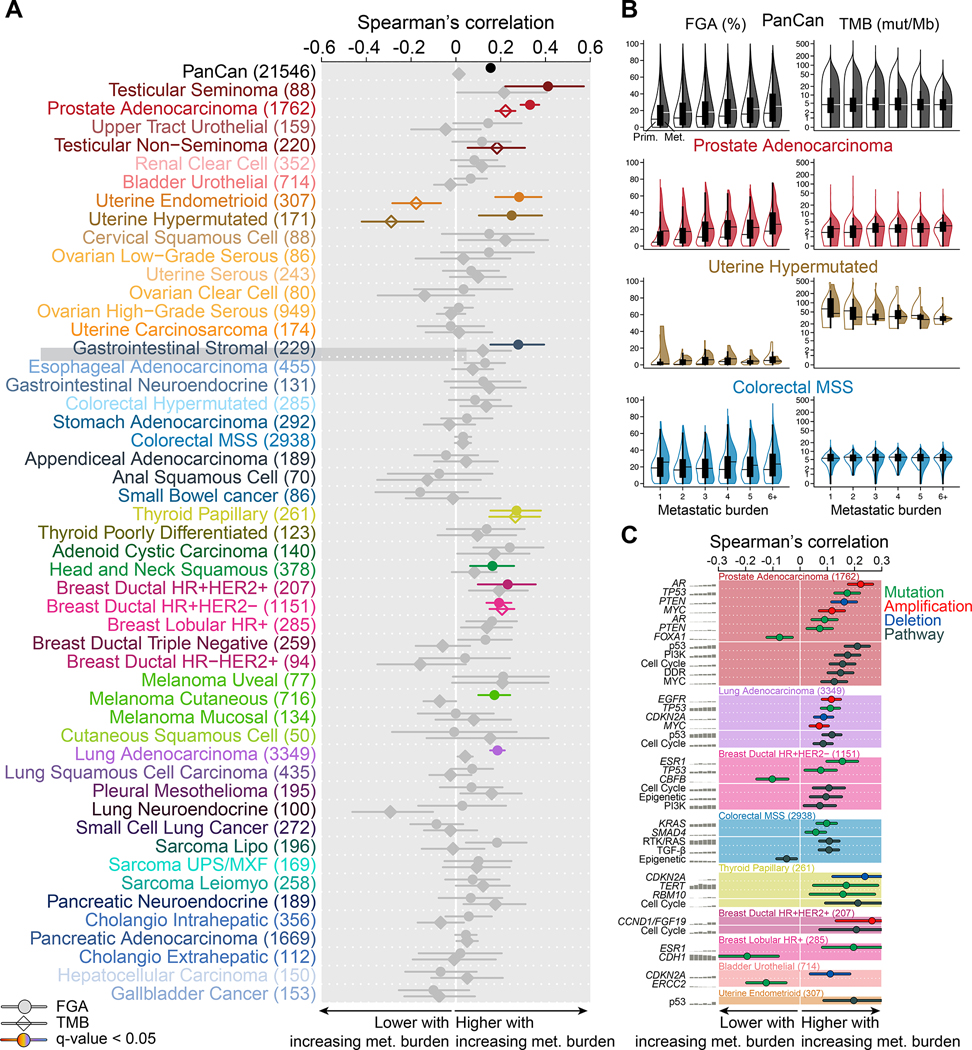
Figure 3. Genomic features associated with metastatic burden.
(A) Spearman’s correlation coefficient between FGA (circle) and TMB (diamond) with metastatic burden. Associations without a significant trend are shown in grey, and the lines indicate 95% CI.
(B) Correlation between FGA and TMB with metastatic burden in the entire data set, prostate adenocarcinoma, hypermutated uterine cancer, and MSS colorectal cancer. Boxplots display median point, IQR boxes and 1.5 × IQR whiskers for all samples. Split violin plots show the distribution of FGA and TMB in primary tumors (left, not filled) and metastases (right, filled).
(C) Statistically significant oncogenic alterations and pathways associated with metastatic burden in individual tumor types. Spearman’s correlation coefficient is shown for each event, and the lines indicate 95% CI. Gene names in italics refer to specific genes, those in regular font refer to pathways.

