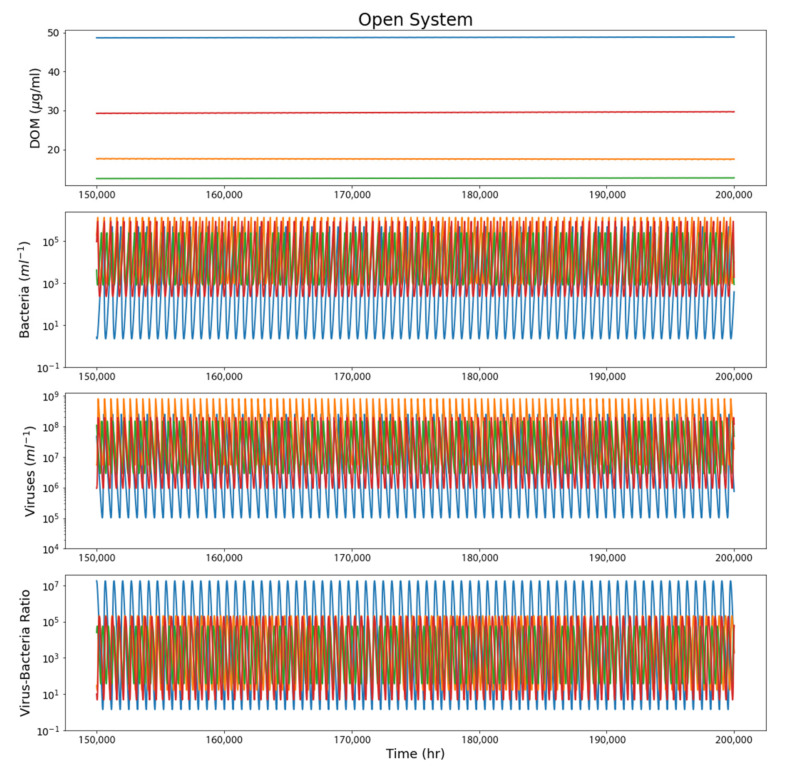
Figure 5.
A sample of 4 runs from the open-system model to better demonstrate the behavior of the steady state. Plots show the last 50,000 h (2500 runs in total were done, with 2342 outliers removed). These runs clearly demonstrate a steady state with no significant increase or decrease in each parameter over time.

