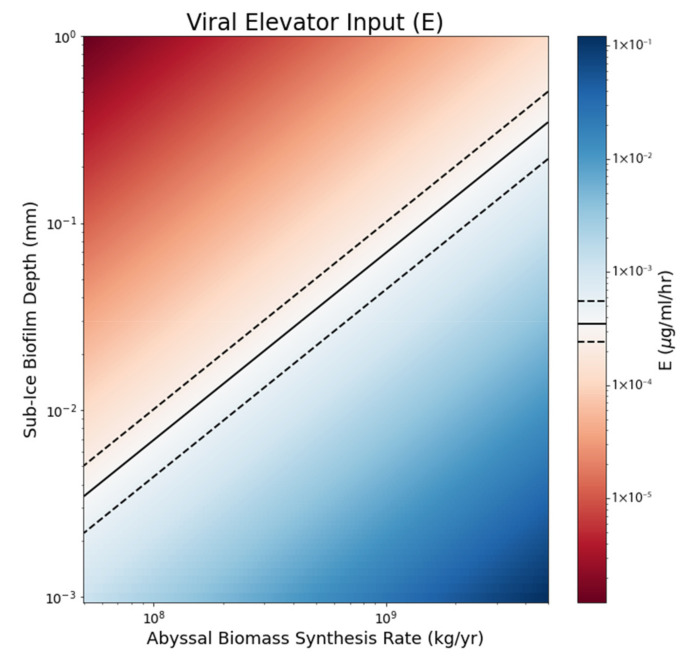
Figure 8.
Colormap diagram of abyssal biomass synthesis rate vs. depth of sub-ice biofilm. Solid contours show the median of the averaged E values from Figure 7, while dashed contours represent the interquartile range. Values for biomass and depth that fall within the blue support a steady state system, while values falling in the red do not. Values that support a steady state suggest that a sub-ice biofilm would be no more than 0.1 mm in thickness.

