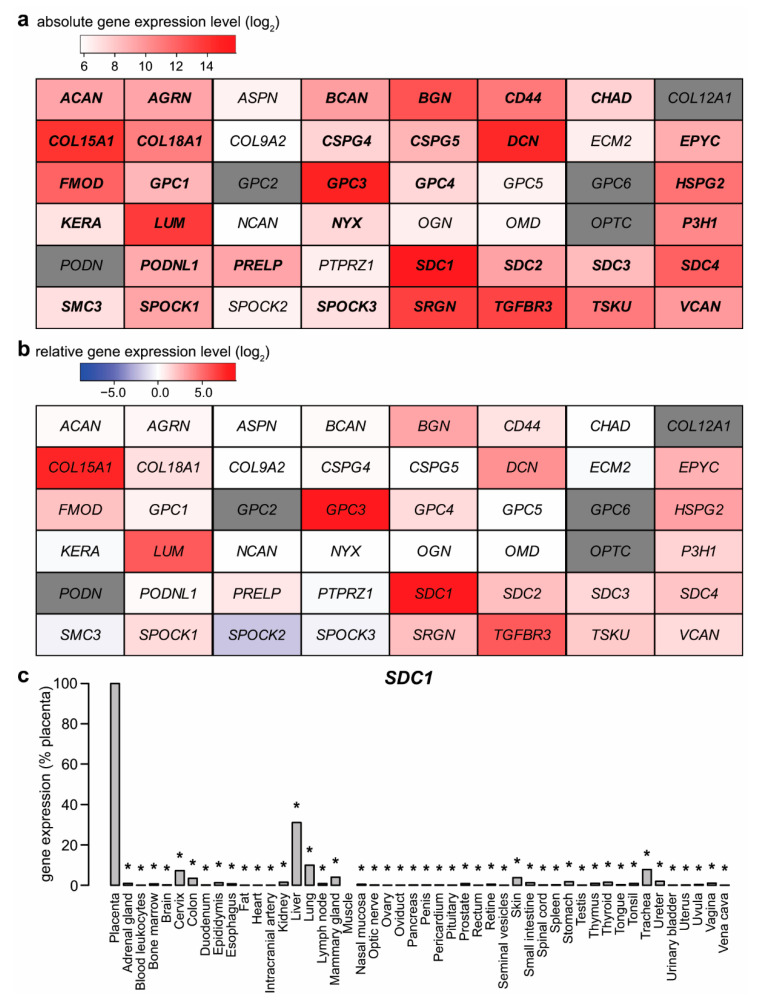
Figure 1.
Placental expression of proteoglycan genes. (a) Absolute microarray gene expression values in the BioGPS database [49,50] were visualized on a heatmap. Color code depicts log2 gene expression levels. Bold letter: expression above threshold 100. Grey color: no data were available. (b) Placental expression of proteoglycan genes was compared to the median expression of 78 other tissues or cells. Differential expression of proteoglycan genes in the placenta was visualized on a heatmap. Color code depicts log2 gene expression ratios. Grey color: no data were available. (c) Real-time quantitative reverse transcription PCR (qRT-PCR) validation of BioGPS data on SDC1 expression in human tissues (n = 3) was visualized on the diagram as the percentage of placental expression. SDC1 mRNA expression values were normalized to RPLP0. Unpaired t-test was used for the analysis of SDC1 expression profiling with the Human Major Tissue qPCR Array. (* p < 0.05). Ribosomal Protein Lateral Stalk Subunit P0—RPLP0; syndecan-1—SDC1.

