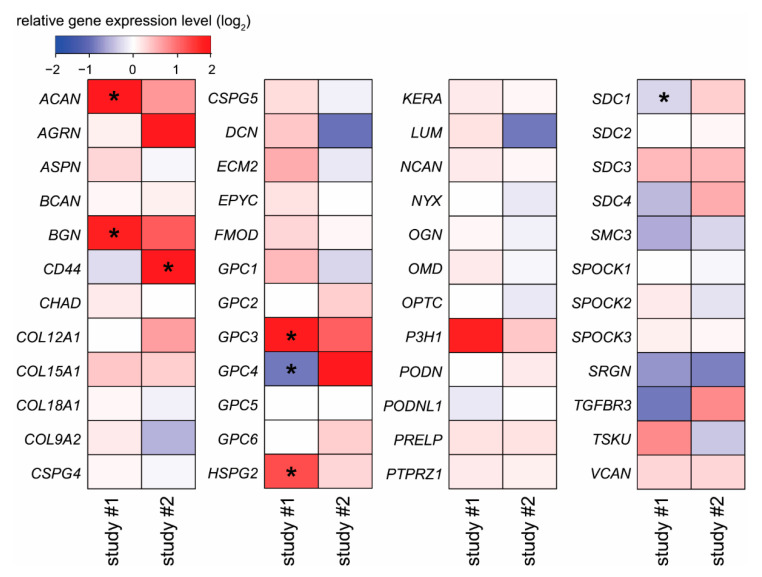
Figure 4.
Differentially expressed proteoglycan genes in invasive extravillous trophoblast cells compared to villous cytotrophoblast cells. Microarray data from two independent GEO (study #1) [63] or ArrayExpress (study #2) [13] datasets were reanalyzed. Color code depicts log2 gene expression ratios. Red indicates higher gene expression in extravillous trophoblasts, while blue depicts higher gene expression in villous cytotrophoblasts. Stars show significant differences.

