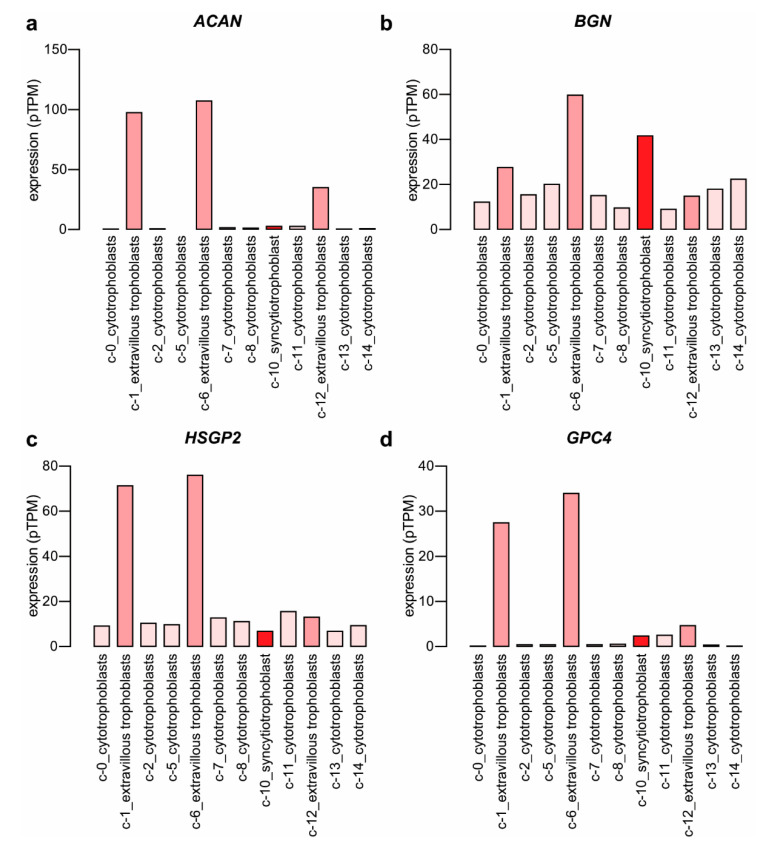
Figure 5.
Expression of selected proteoglycan genes in the placenta. Single-cell RNA-seq data were downloaded from the Human Protein Atlas [56]. The original study was performed by Vento-Tormo et al. [55]. ACAN (a), BGN (b), HSPG2 (c), and GPC4 (d) mRNA expression (pTPM) in trophoblast cell clusters (colored with shades of red) were visualized on a bar chart. Protein-transcripts per million—pTPM.

