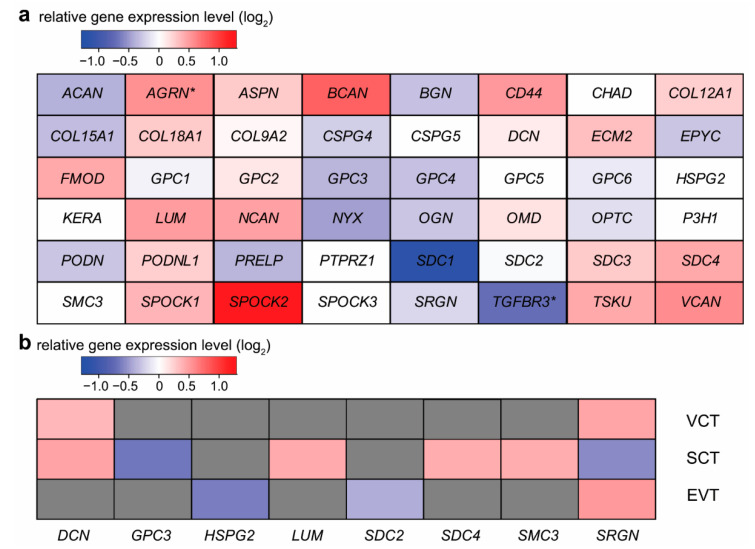
Figure 6.
Placental proteoglycan gene expression in pre-eclampsia. (a) Placental microarray data from women with early-onset pre-eclampsia (n = 12) and preterm controls (n = 5) were published by Than et al. [51]. Color code depicts log2 gene expression ratios between cases and controls. Red indicates higher gene expression, while blue depicts lower gene expression in pre-eclampsia. Stars show significant differences. (b) Single-cell RNA-seq data from women with early-onset pre-eclampsia and preterm controls were published by Zhang et al. [70]. Differentially expressed genes in villous cytotrophoblasts (VCT), in the syncytiotrophoblast (SCT), and in extravillous trophoblasts (EVT) were visualized on a heatmap. Red indicates higher gene expression, blue depicts lower gene expression in pre-eclampsia (log2 fold change, q-value < 0.05), and grey depicts non-differentially expressed genes.

