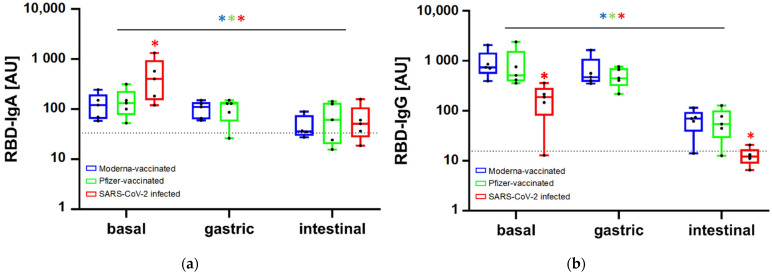
Figure 2.
Change in anti-SARS-CoV-2 IgA (a) and IgG (b) levels along the simulated gastrointestinal digestion in the breast milk samples from the three study groups. In the SARS-CoV-2 infected group an aliquot at the gastric stage was not collected due to the scarce amount of sample. The horizontal dotted line indicates the cut-off value established as per pre-pandemic breast milk samples. * indicates statistically significant differences (p < 0.05) between groups of samples within each timepoint and between time points considering each group of samples (blue * for Moderna-vaccinated, green * for Pfizer vaccinated and red * for SARS-CoV-2 infected).

