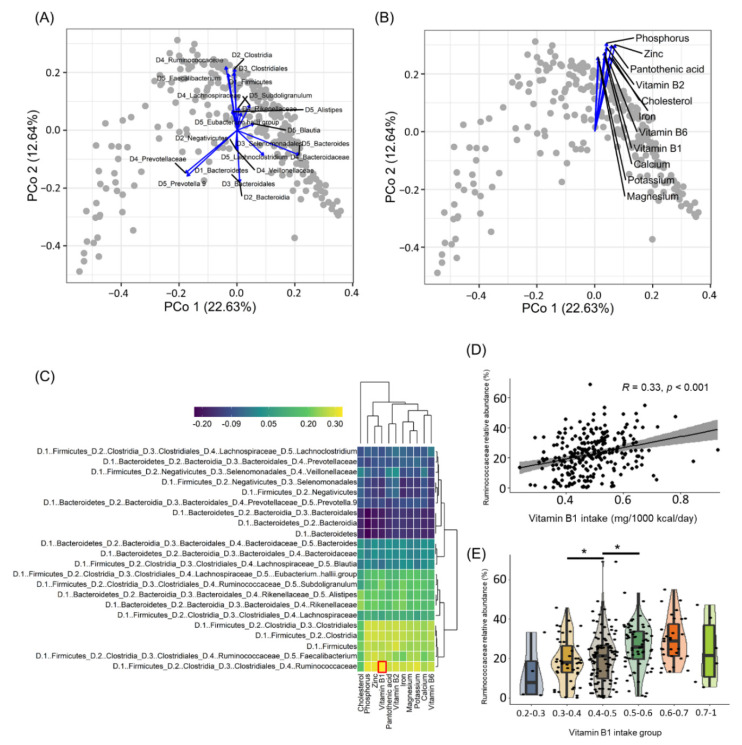
Figure 1.
Correlation between gut bacterial community and nutrients. (A,B) Principal coordinate analysis of the Bray–Curtis distance for genus-level relative abundance data. Covariates of the bacterial relative abundance and nutrients intake were identified by calculating the association between each continuous data and genus-level community ordination with the envfit function in the vegan R package. Variables that have been significantly related to coordinates are described (p-value < 0.001). (C) Spearman correlation analysis was performed to elucidate the relationship between gut bacterial relative abundance and nutrients (n = 257; p-value < 0.05 [|r| > 0.12]). The red square is the result of the highest correlation. (D) Correlation between the Ruminococcaceae family and vitamin B1 is shown by scatterplots. (E) Boxplot for comparison of Ruminococcaceae family relative abundance between groups grouped by vitamin B1 intake (vitamin B1 intake groups; blue: 0.2–0.3 mg/1000 kcal/day, yellow: 0.3–0.4 mg/1000 kcal/day, brown: 0.4–0.5 mg/1000 kcal/day, dark green: 0.5–0.6 mg/1000 kcal/day, orange: 0.6–0.7 mg/1000 kcal/day, green: 0.7–1 mg/1000 kcal/day). * p-value < 0.05.

