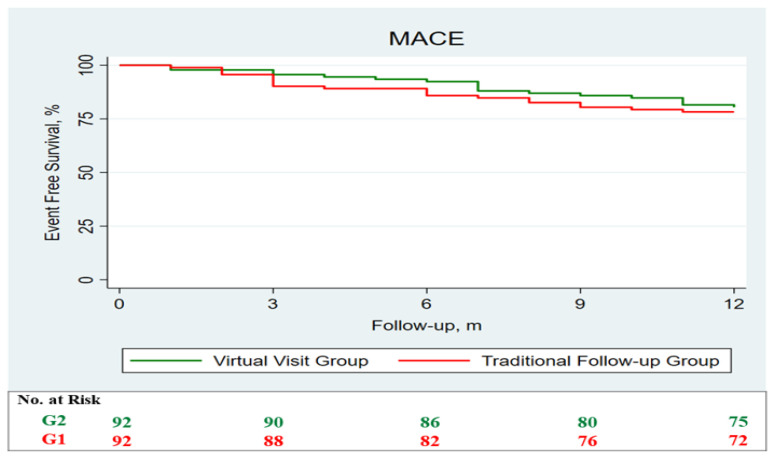
Figure 2.
Survival analysis regarding the primary endpoint performed through the Kaplan–Meier method. Survival analysis demonstrates no differences in term of MACE, which is a composite of overall mortality, acute myocardial infarction, stroke, and hospitalization due to heart failure, between the two groups. G1 (red) is the group followed up through traditional in-person visits, while G2 (green) represents the virtual visit group.

