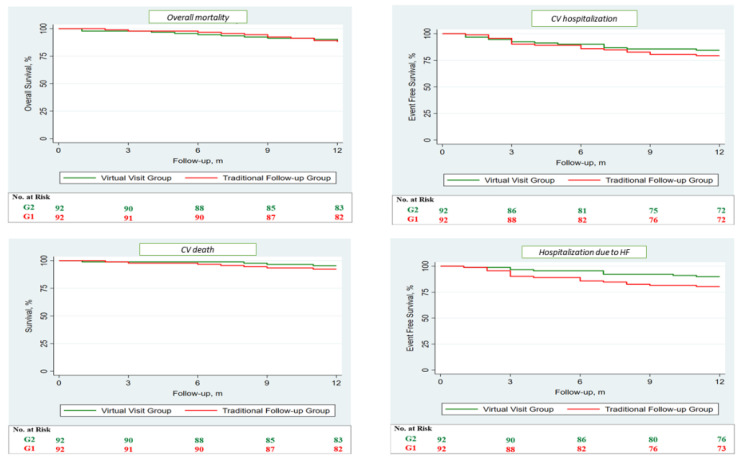
Figure 3.
Survival analysis regarding the single secondary endpoints performed through Kaplan–Meier method. Survival analysis demonstrates no differences regarding the single secondary endpoints of overall mortality, cardiovascular death, cardiovascular hospitalization, and hospitalization due to HF between the two groups. G1 (red) is the group followed up through traditional in-person visits, while G2 (green) represents the virtual visit group. CV: cardiovascular; HF: heart failure.

