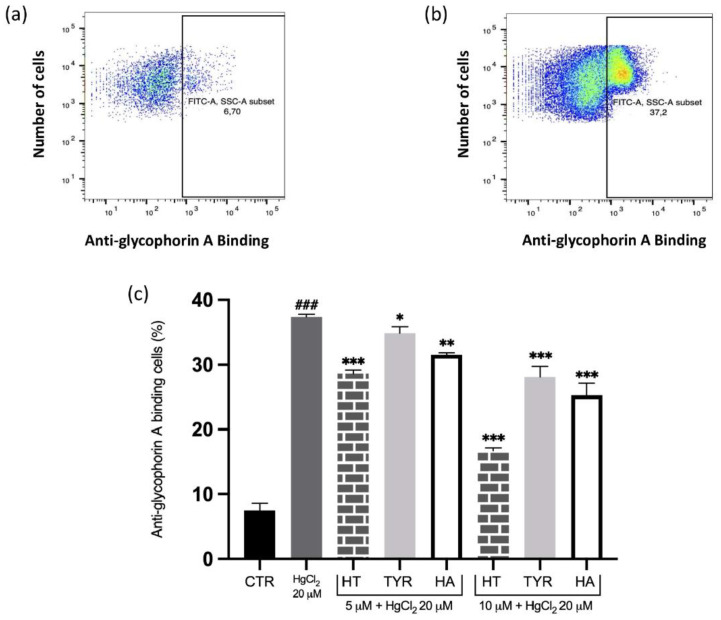
Figure 3.
Effect of HT and its analogue on Hg-induced MVs formation from RBC. Cells were treated with HgCl2 in the presence of increasing concentrations of HT, Tyr and HA and MVs formation was evaluated using FITC anti-human glycophorin A antibody. (a) Original histogram of control cells (CTR). (b) Original histogram of Hg-treated cells. (c) Histogram of phenols effect on Hg treatment. Data are the means ± SD (n = 9). Statistical analysis was performed with one-way ANOVA followed by Tukey’s test. ### (p < 0.001) indicates a significant difference from CTR. *** (p < 0.001), ** (p < 0.01) and * (p < 0.05) indicates a significant difference from Hg treatment. MVs: microvesicles; RBC: red blood cell, HT: hydroxytyrosol; Tyr: tyrosol; HA: homovanillic alcohol; FITC: fluorescein isothiocyanate.

