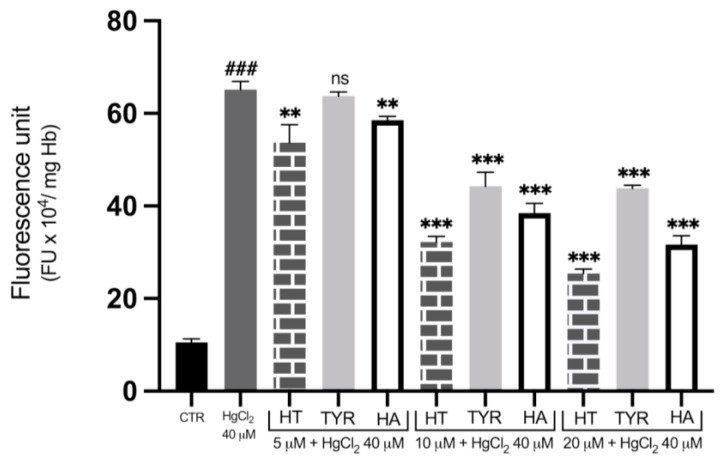
Figure 6.
Effect of HT and its analogues on Hg-induced ROS production in RBC. Cells were treated with HgCl2 in the presence of increasing concentrations of HT, Tyr and HA and ROS production was evaluated by means of the fluorescent probe DCF. Data are the means ± SD (n = 9). Statistical analysis was performed with one-way ANOVA followed by Tukey’s test. ### (p < 0.001) indicates significant difference from control (CTR). *** (p < 0.001), ** (p < 0.01), indicate a significant difference from Hg treatment. ns (p > 0.05) indicates no significant difference from Hg treatment. ROS: Reactive oxygen species; RBC: red blood cell; HT: hydroxytyrosol; Tyr: tyrosol; HA: homovanillic alcohol; DFC: dichlofluorescein.

