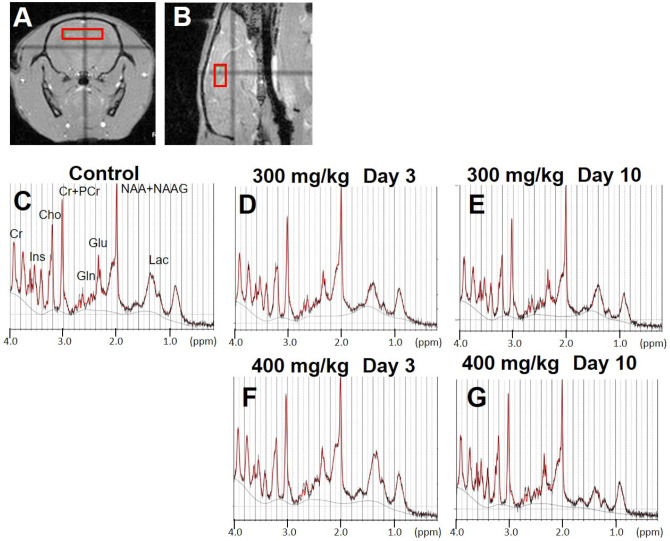
Figure 4.
(A,B) show regions of interest in the hippocampus used for the analysis of MRS data. (A) is axial slice and (B) is sagittal slice sections. (C–G) indicate MR spectra compared to the control concentration. MRS, magnetic resonance spectroscopy. These five MR spectra show control (C), 300 mg/kg TAA injection (D,E), and 400 mg/kg TAA injection (F,G) groups. TAA, thioacetamide, NAA + NAAG, N-acetylaspartate + N-acetylaspartylglutamate; Cr + PCr, creatine + phosphocreatine; Cho, choline; Gln, glutamine; Glu, glutamate; Lac, lactate; Ins, myo-inositol.

