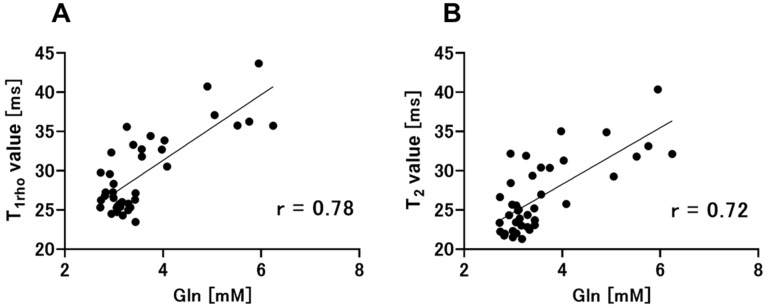
Figure 6.
Pearson’s correlation coefficients and correlation analysis were performed to compare the two groups (T1ρ relaxation times vs. brain Gln levels, T2 relaxation times vs. brain Gln levels). (A) The analysis of T1ρ relaxation times and brain Gln levels also indicates a positive correlation between these parameters (r = 0.78, p < 0.01). (B) T2 relaxation times are positively correlated with brain Gln levels (r = 0.72, p < 0.01). Gln, glutamine.

