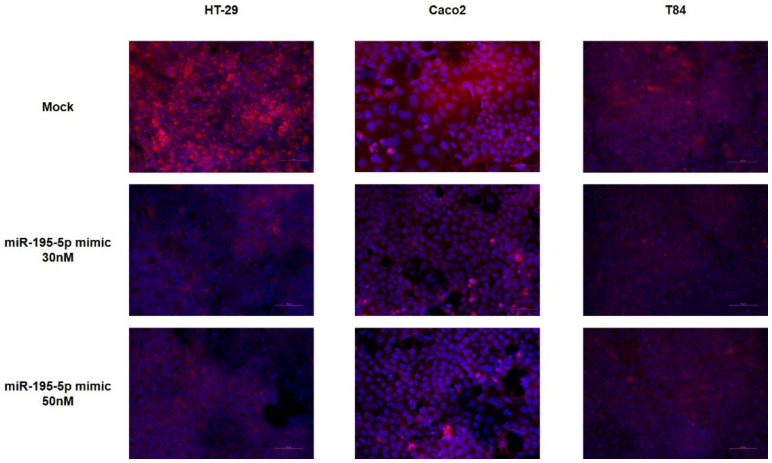
Figure 3.
Immunofluorescence staining of cell monolayers exposed to TNF-α and transfected with miR-195-5p mimic at 30 and 50 nM. The immunofluorescence staining shows the same protein expression pattern of western blot analysis. The images were acquired at 20× magnification. Scale bar represents 50 μm.

