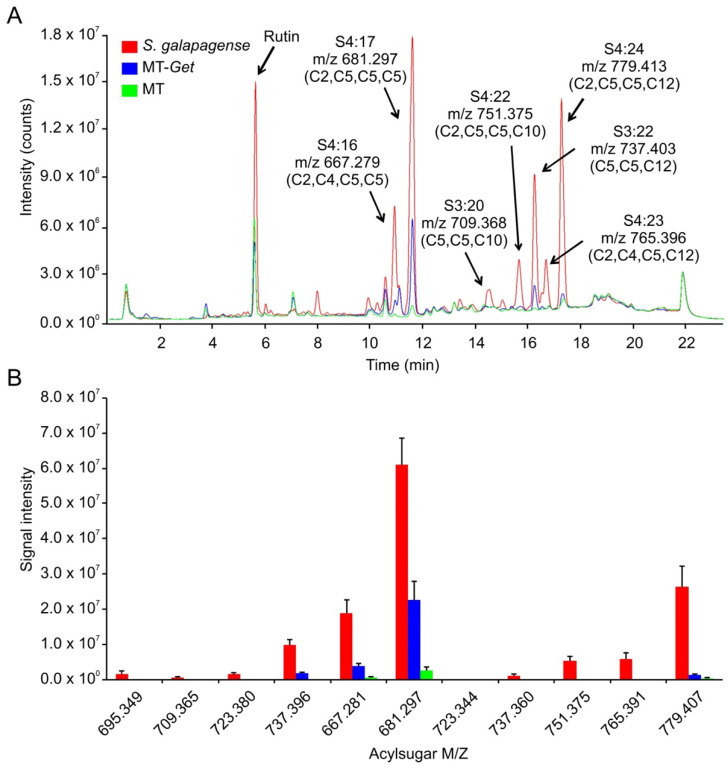
Figure 6.
Acylsugar (AS) content in Solanum galapagense LA1401, Micro-Tom (MT), and MT-Get. (A) Representative LC-MS/MS chromatogram. Peak area quantifications and statics are shown in Table 1. (B) Signal intensity for each of the AS analyzed in the three genotypes. The symbols used to classify acylsugars are detailed in the Introduction section.

