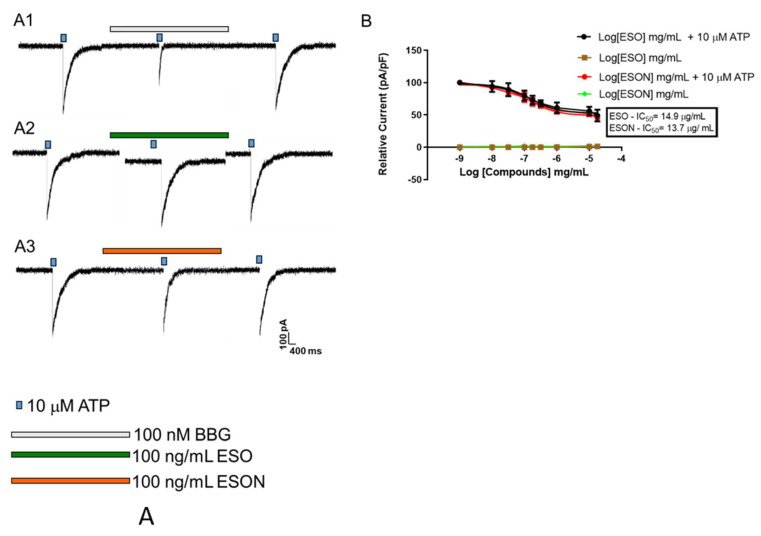
Figure 2.
Dose–concentration curves for ESO and ESON inhibition on P2X7R cationic channel activity. (A) Whole-cell recordings of the cationic P2X7R activated by 10 µM ATP for 5 s at 30–37 °C on MPM. The reversibility of the inhibitory effect: a pulse of 10 µM ATP followed by perfusion of concentrations of ESO, ESON, or 100 nM BBG. After the washout, another pulse of 10 µM ATP was applied; (B) the plot represents the quantification of the data observed in (A1–A3); % relative current was recorded as a function of the ratio between the amplitude of the ionic current and cell capacitance. In all assays, we added the antagonists before ATP stimulation (1–10 min). Profiles are representative of 4 experiments for whole-cell recordings. p > 0.05 when compared to positive control.

