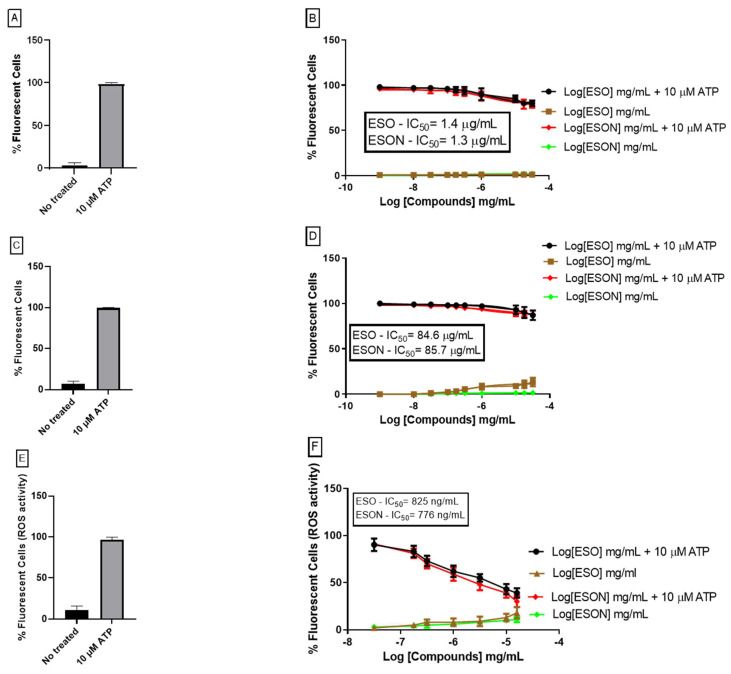
Figure 3.
ESO and ESON effect on P2X7R activity. (A) No treated cells and cells treated with ATP analyzed with Sodium Green assay. (B) Dose–response curves of ESO and ESON with or without 10 µM ATP to detect changes in intracellular Na+ concentrations with Sodium Green assay. (C) No treated cells and cells treated with ATP analyzed with Fluo-3 assay. (D) Flow cytometry analyzed the dose–response curves of ESO and ESON with or without 10 µM ATP to detect changes in intracellular Ca2+ with Fluo-3 dye. (E) No treated cells and cells treated with ATP analyzed with DCFH2-DA dye. (F) Dose–response curves of ESO and ESON with or without 10 µM ATP analyzed by fluorescence plate reader to detect changes in intracellular ROS with DCFH2-DA dye; Values represent mean + SEM of total % ATP fluorescence effect. Profiles are representative of 3 separate experiments for Na+ and Ca2+ assay and 7 separate experiments for ROS assay.

