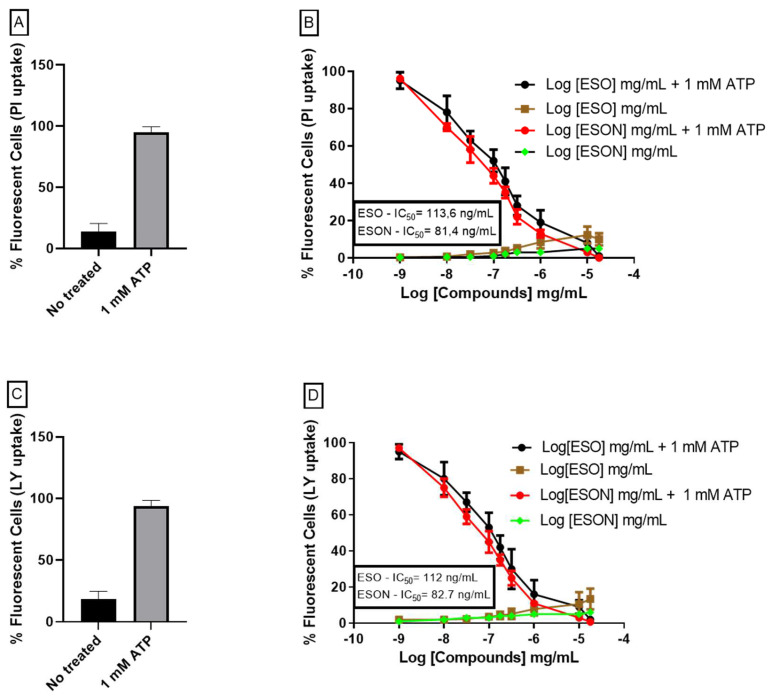
Figure 4.
Dose–concentration curves for ESO and ESON inhibition on pore formation activity. (A) No treated cells and cells treated with ATP analyzed with PI-uptake assay assay; (B) The graph represents the quantification of dye uptake assays performed to 37 °C on MPM. Dose-response curves of ESO and ESON with or without 1 mM ATP for 25 min analyzed by fluorescence plate reader to detect the PI uptake; (C) No treated cells and cells treated with ATP analyzed with LY-uptake assay; (D) dose–response curves of ESO and ESON with or without 1 mM ATP for 25 min analyzed by fluorescence plate reader to detect the LY uptake. Values represent mean + SEM. Profiles are representative of 3–6 independent experiments.

