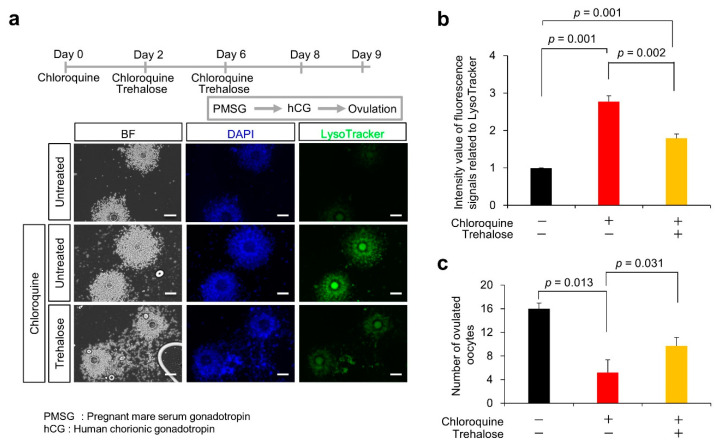
Figure 5.
Partial rescue of decrease in chloroquine-induced ovulated oocytes number through trehalose treatment. (a) Experimental flow. As depicted in (a), chloroquine alone or in combination with trehalose was injected into 7-week-old female mice (each group: n = 5). To examine the lysosomal distribution, cells were stained with LysoTracker Green DND26 (green). Scale bars, 100 μm. (b) Quantification of fluorescent intensities of lysosomes (over 200 cells were counted in each case). The signal intensity in COC without chloroquine or trehalose treatment (black bar) was arbitrarily set at 1. The graph (red bar; chloroquine alone, yellow bar; in combination with trehalose) indicates the relative intensity value of fluorescence signals related to LysoTracker against that in COC without chloroquine or trehalose treatment (black bar). (c) Number of ovulated oocytes after chloroquine alone (red bar) or in combination with trehalose (yellow bar). Black bar indicates number of ovulated oocytes without chloroquine or trehalose treatment. Ovulated oocytes were collected from the superovulation-induced female with and without chloroquine and metaphase II-arrested oocytes were counted. Values are expressed as the mean ± SE.

