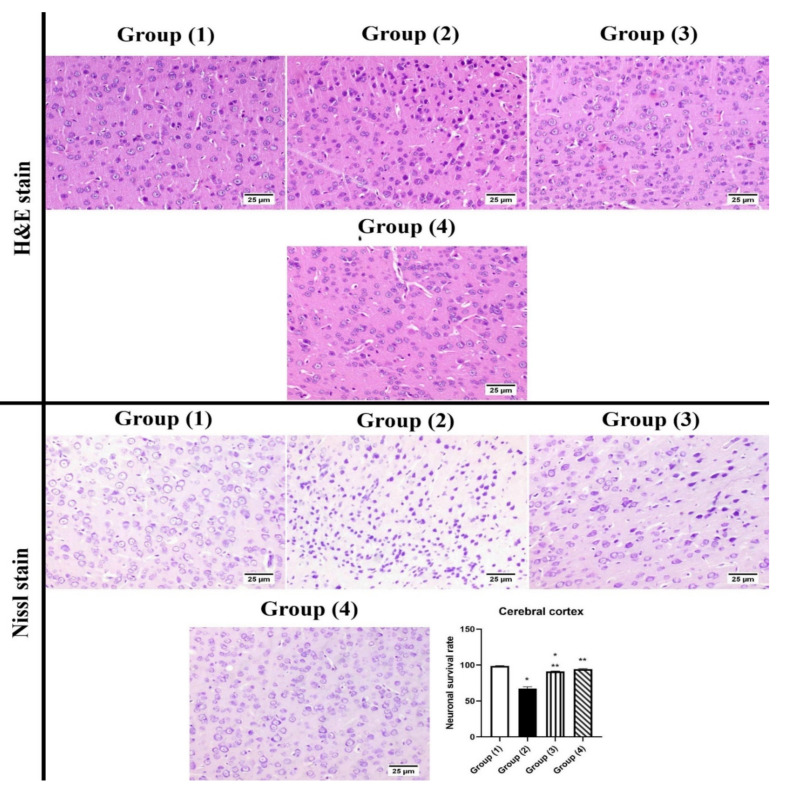
Figure 5.
Photomicrograph of brain, cerebral cortex (H&E and Cresyl violet stains). Normal hippocampus in group (1), group (2) showed numerous shrunken neurons. Group (3) showed few degenerated neurons. Group (4) showed apparently normal cerebral cortex. The chart represents neuronal survival rate, statistical analyses were performed using ANOVA (one-way analysis of variance) followed by Tukey post hoc test. Each value was expressed as mean ± SD. *: Statistically significant different from the normal group at p < 0.05, **: Statistically significant different from the positive control group (STZ, 3 mg/kg) at p < 0.05.

