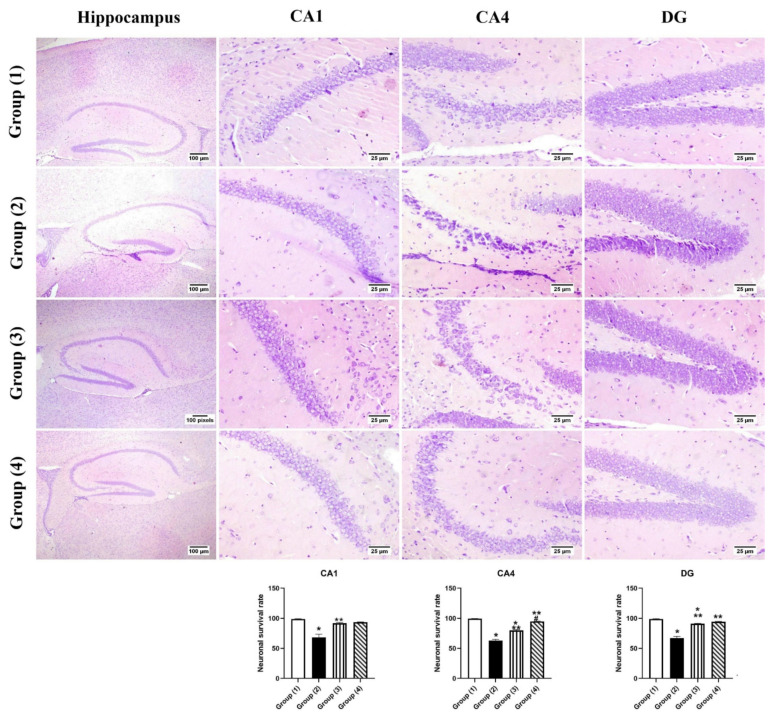
Figure 7.
Photomicrograph of brain, hippocampus region (Cresyl violet stain), showing intact neurons within the different hippocampus regions in group (1), group (2) showed dark stained degenerated neurons within hippocampus regions, groups (3) and (4) showed apparently normal hippocampus. Charts represent neuronal survival rates, data expressed as means ± SE. Significant difference was considered at p < 0.05. *: Statistically significant different from the normal group at p < 0.05, **: Statistically significant different from the positive control group (STZ, 3 mg/kg) at p < 0.05. #: Statistically significant different from luteolin suspension group (50 mg/kg).

