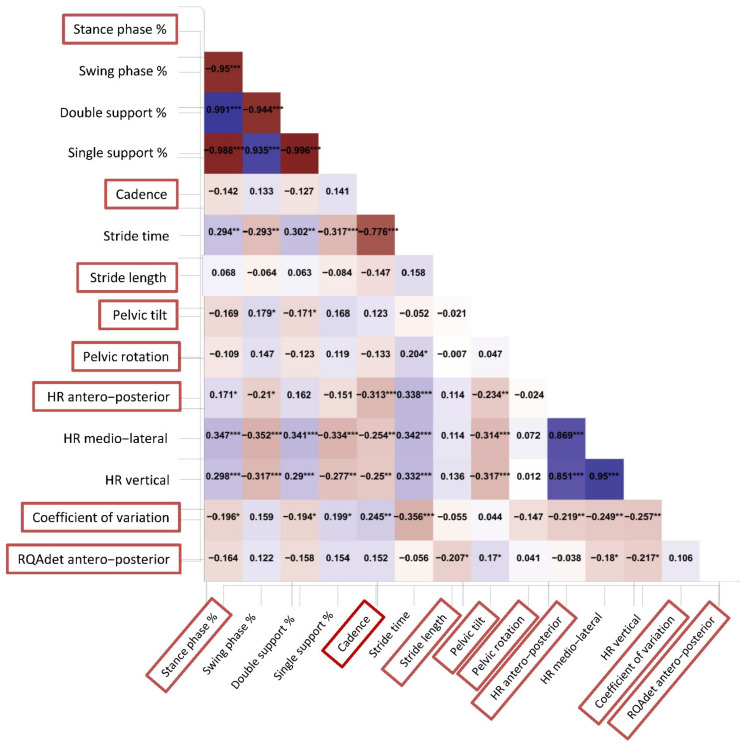
Figure 4.
Partial correlation heatmap. Partial Pearson correlation analysis was performed to evaluate relationships among the initial set of features. A heatmap of the dataset’s characteristics showed different Pearson coefficients for every single variable. The deeper the red or blue color, the stronger the negative or positive correlation, respectively. In the decision process, we reduced the dimensionality of dataset according to the choice of which parameter we could keep that showed a partial correlation value ≥ 0.50 to prevent multicollinearity issues: *, p < 0.05; **, p < 0.01; ***, p < 0.001.

