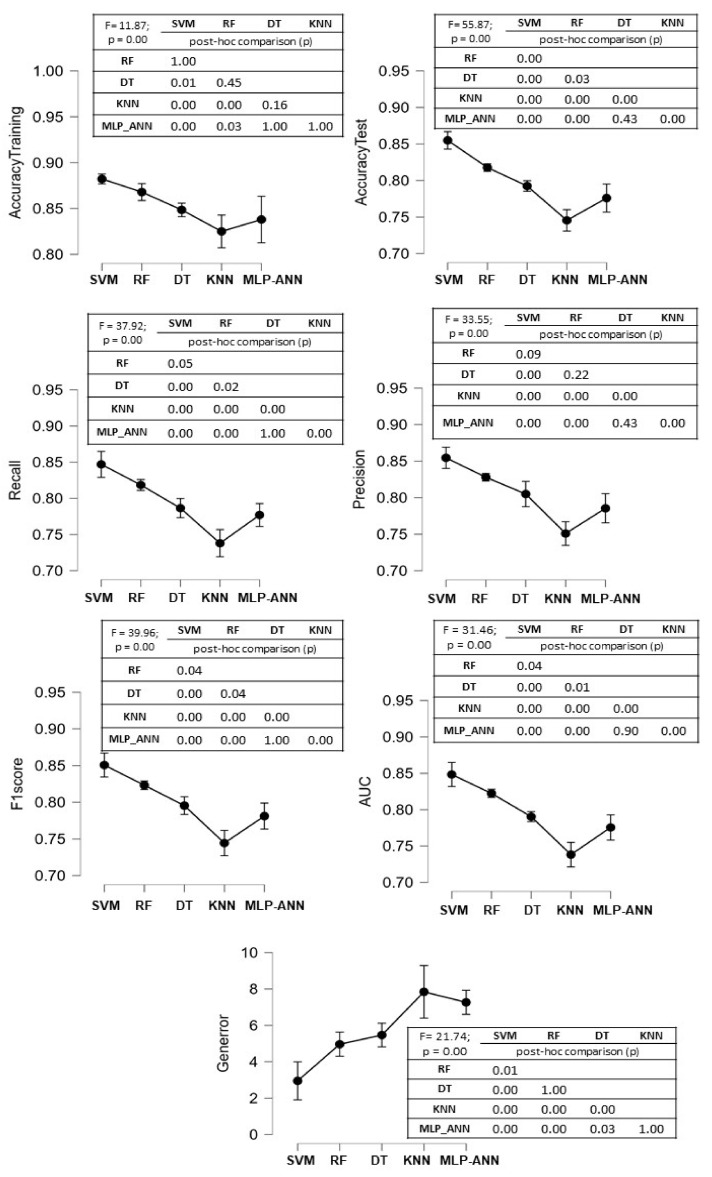
Figure 7.
Comparison between the classification performance measures in the 7-features model. The mean and standard deviation values of the 10 runs for each performance measure for each ML algorithm are shown in the figure. The F values of the ANOVA procedure are reported, as well as the p-values of Bonferroni’s post hoc analysis.

