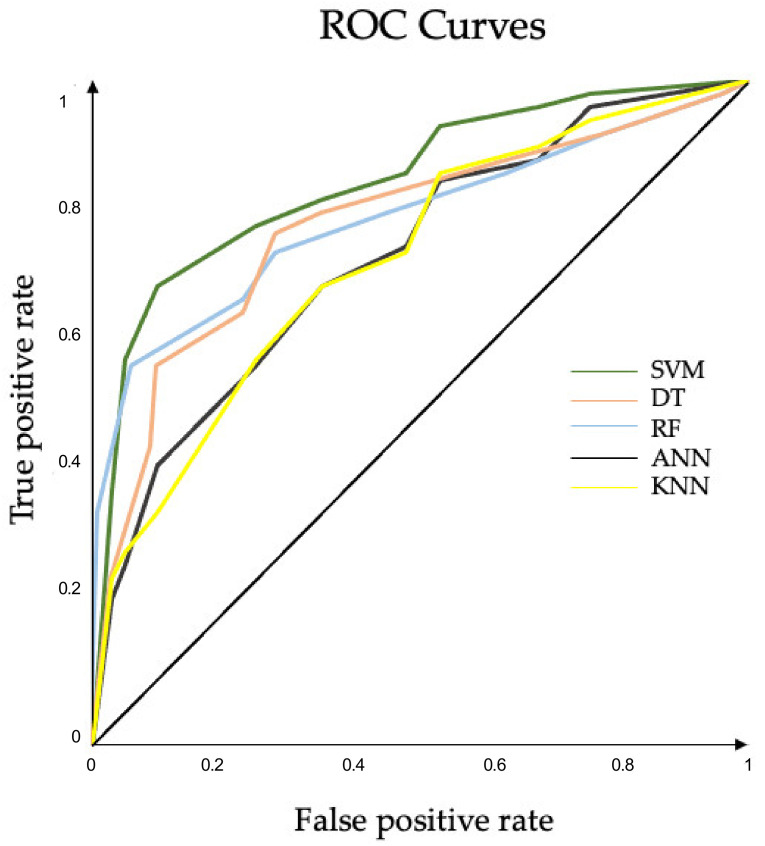
Figure 9.
ROC curves. Plots of the runs that achieved the best AUCs in features selected approach for each ML algorithm. AUC SVM (0.877), AUC RF (0.827), AUC DT (0.820), AUC ANN (0.810), AUC KNN (0.778): ROC, receiver operating characteristic; AUC, area under curve; SVM, support vector machine; RF, random forest; DT, decision tree; KNN, K-nearest neighbor; ANN, artificial neural network. ROC curves for the maximum accuracies obtained by each classifier.

