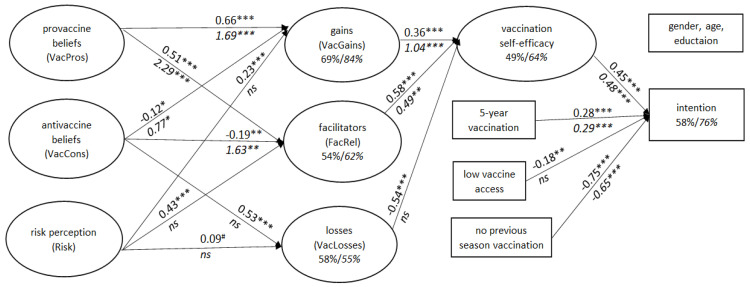
Figure 2.
The result of SEM in medics (n = 301; path coefficients in italics below the arrows) and non-medics (n = 408; path coefficients in regular font above the arrows) analyzed for each group separately (showed in one figure for better visualization). Note: *** = p < 0.001; ** = p < 0.01; * = p < 0.05; # = p = 0.05; ns = not significant.

