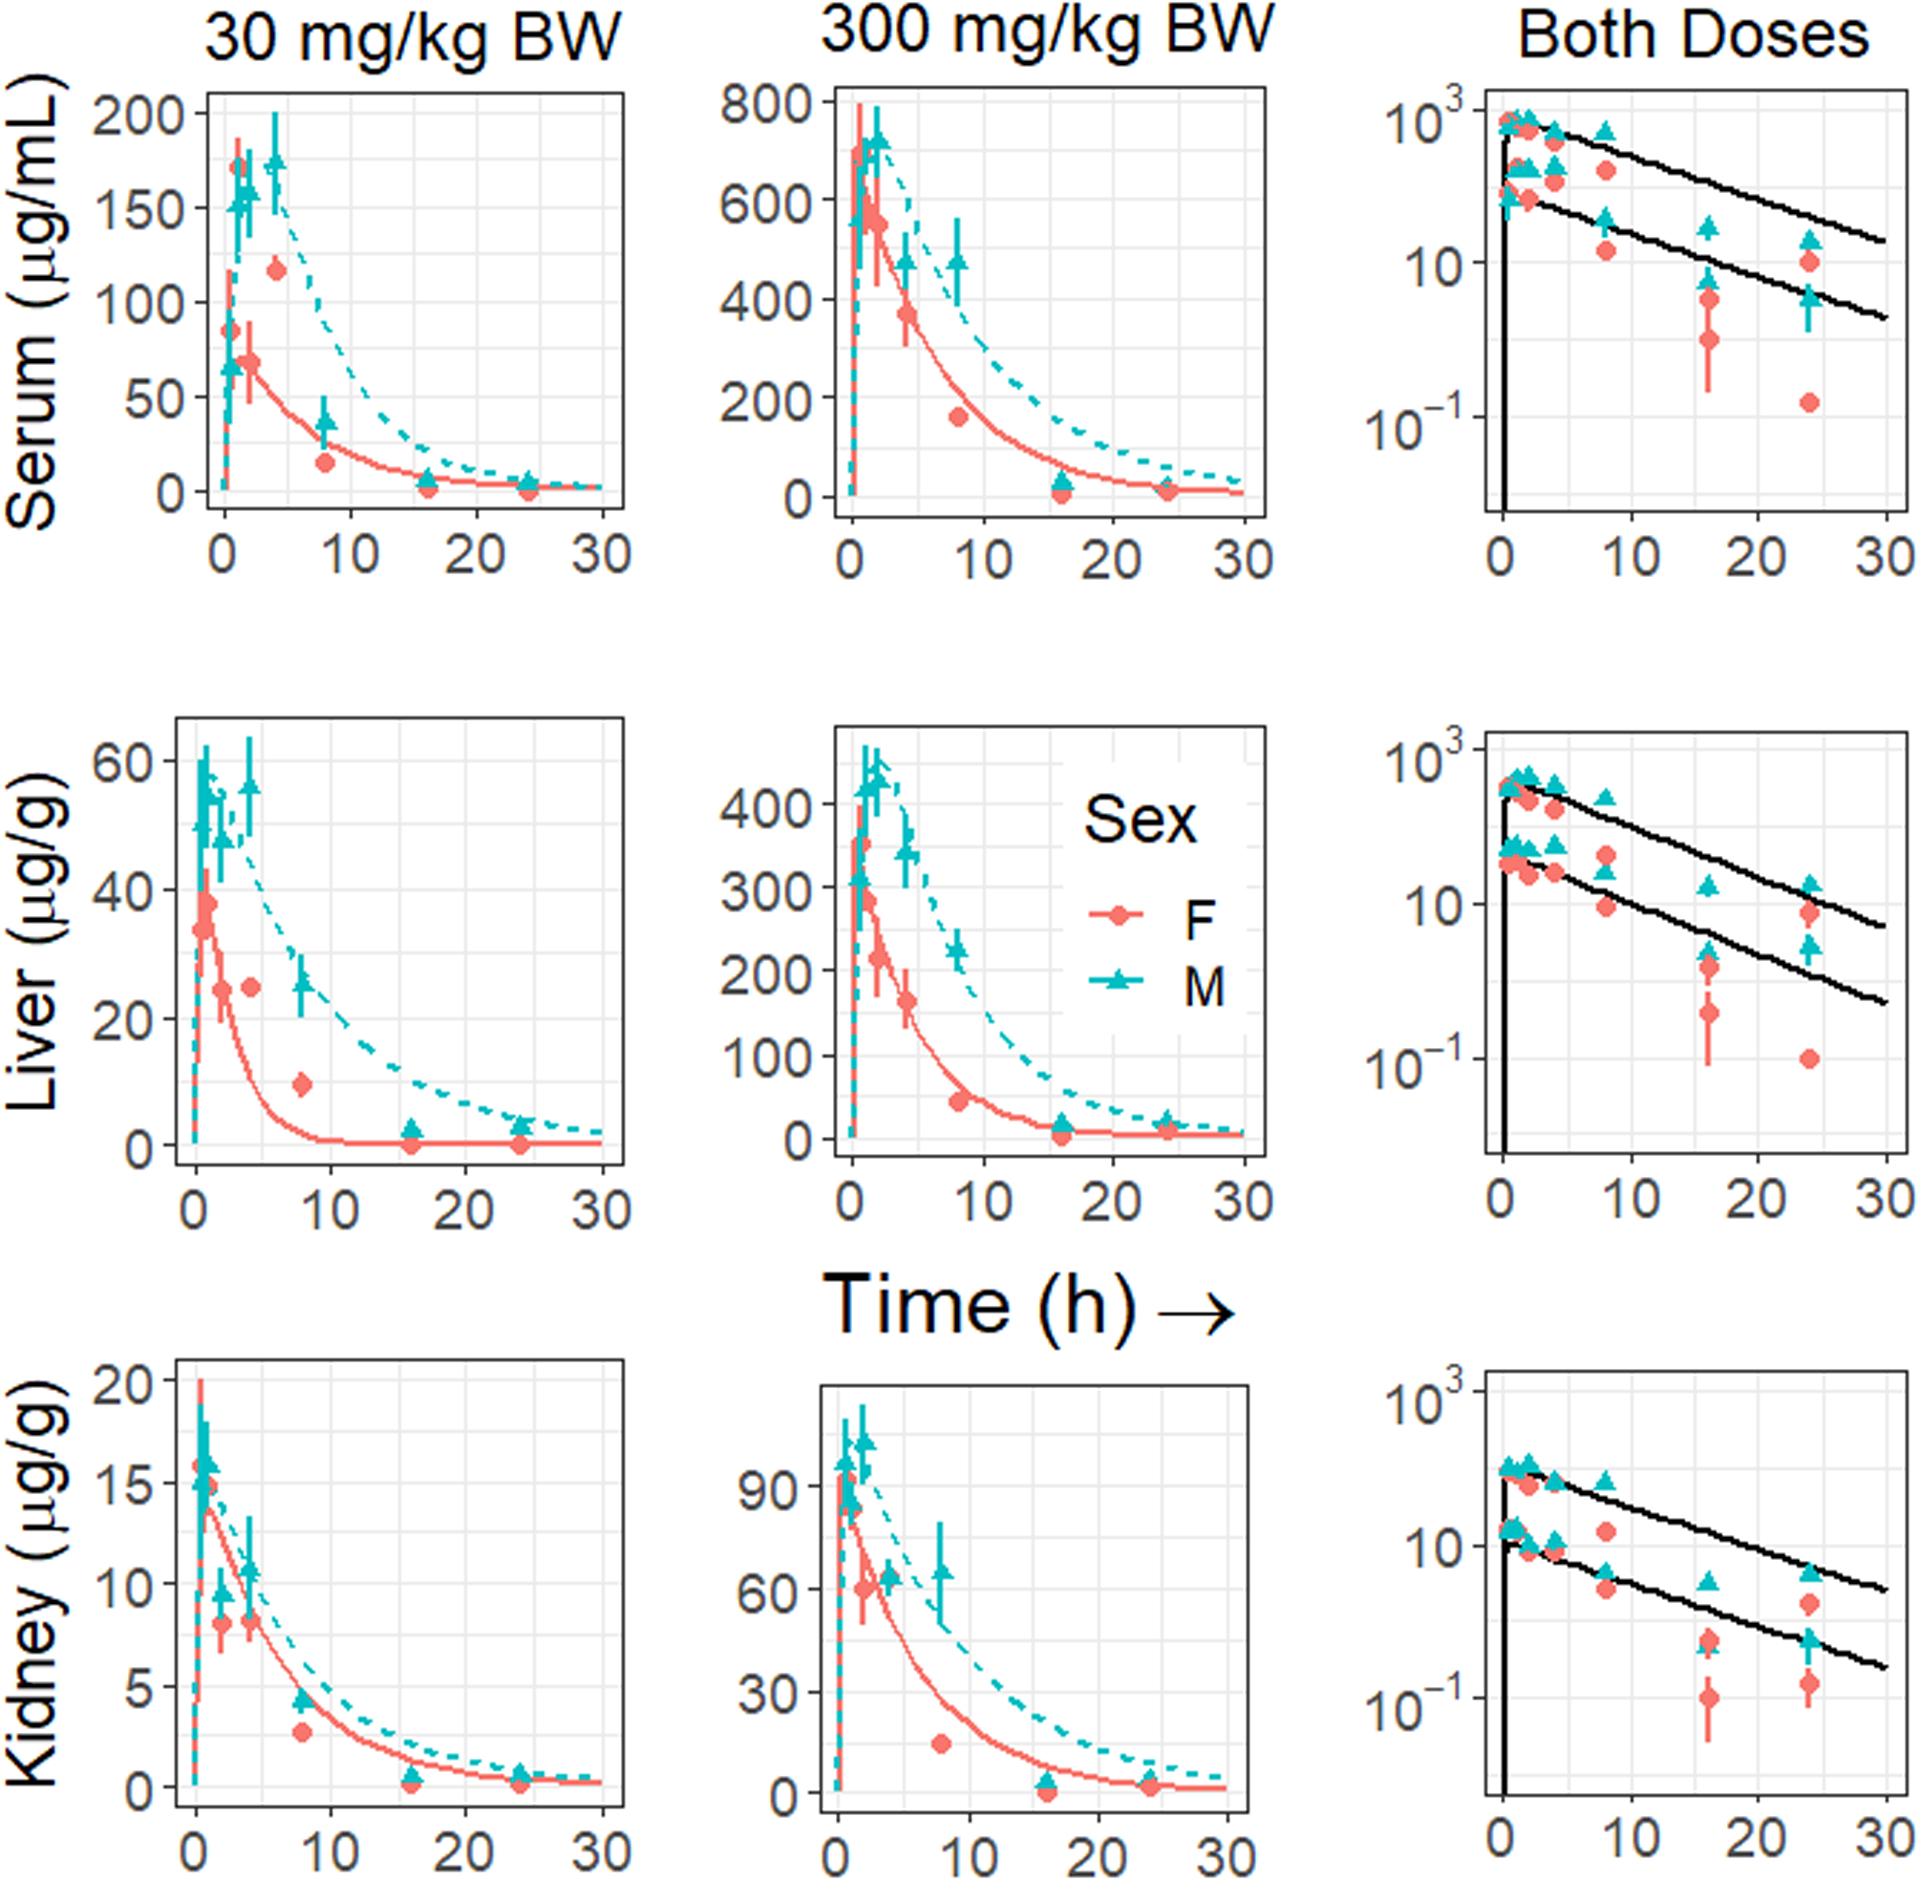
Fig. 1.

Serum, kidney and liver concentrations of PFBS during 24 h after a single oral gavage of the chemical at 30 (left panels) or 300 mg/kg (middle panels) in male and female mice. The right panels illustrate the combined doses. Data are expressed as means and standard errors of 6–12 animals. Males are illustrated by blue triangles and females by pink circles; curves are fitted by the computational model. Predictions for the optimized sets of parameters are shown for separate optimizations for females (solid line) and males (dashed line) but the same parameters for both doses in the first two-columns. In the third column a single set of parameters optimized for both sexes and doses is used to make the predictions (solid line); these predictions are further evaluated in Supplemental Figures 2–4
