Figure 1.

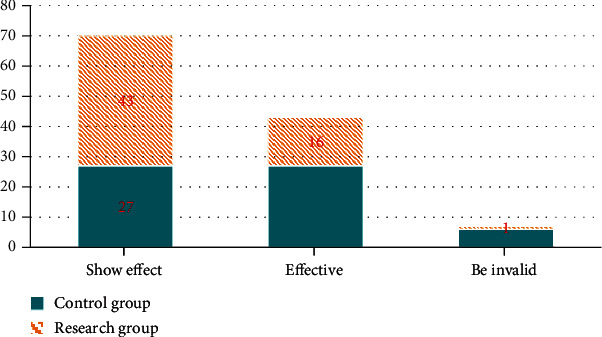
Comparison of clinical efficacy between two groups. The green bar represents the control group, and the yellow bar represents the research group.

Comparison of clinical efficacy between two groups. The green bar represents the control group, and the yellow bar represents the research group.