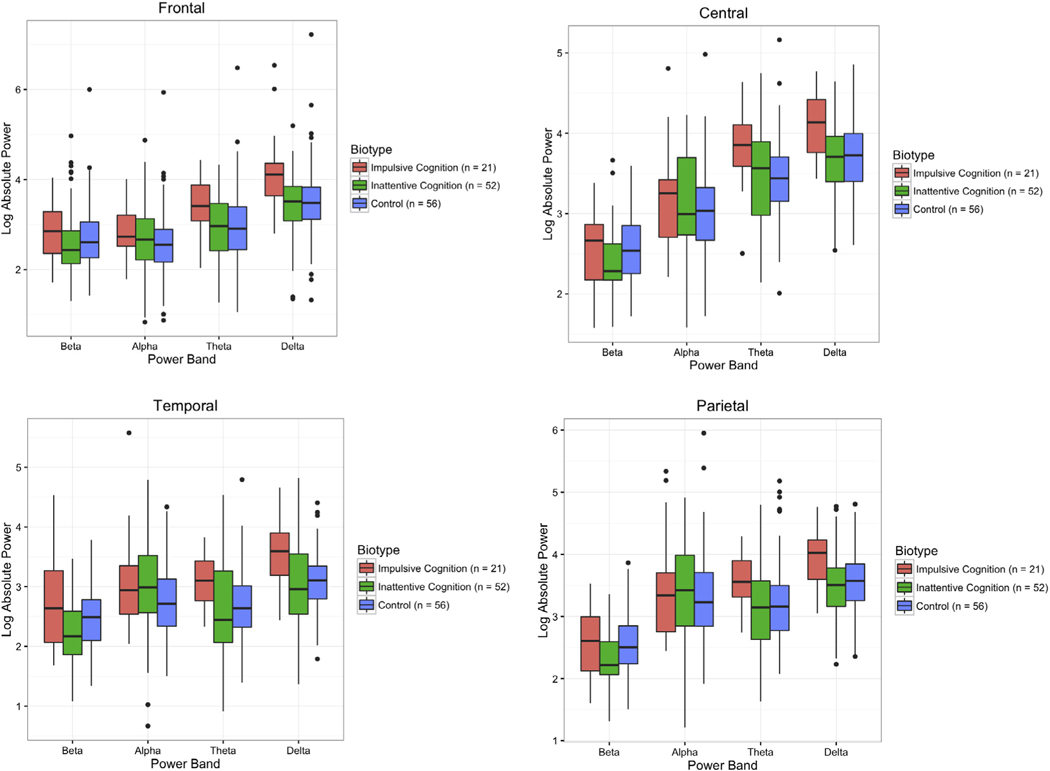
Fig. 2.
EEG Power By Biotype Across Regions and Spectral Bands. Note: Each panel represents averaged power across the indicated leads, with the elevated global slow wave profile of the impulsive cognition biotype clearly visible. Note also the generally elevated frontal beta and relatively decreased frontal beta of the inattentive cognition biotype. Multiple regions are presented for thoroughness, though the trends are similar across regions. In contrast, there are not consistent differences by DSM subtype (not pictured). Center lines represent median values, colored areas interquartile range, whiskers the last point within 1.5 times the interquartile range of the upper/lower quartiles, and points further outliers.

