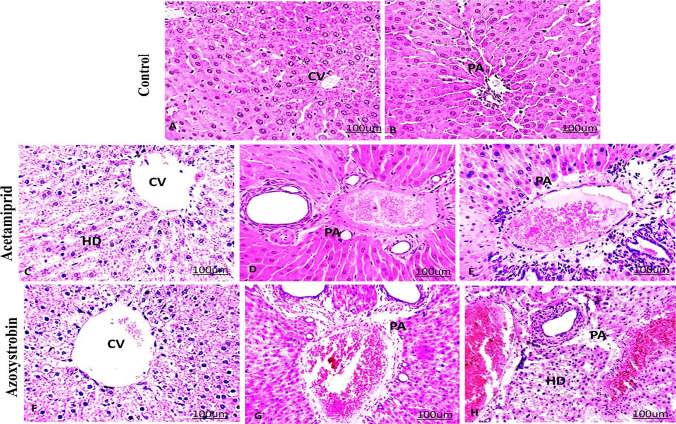
Fig. 3.
Effect of acetamiprid and azoxystrobin on liver tissue of rats. A, B Histological sections of the liver of control rats showed normal liver central vein (CV) and a normal portal area (PA). Liver sections of the treated group with acetamiprid with different doses (C–E). C Low dose demonstrated hydropic degeneration (HD), D medium dose demonstrated infiltration of mononuclear cells (arrow), hypertrophied and edema of portal area (PA), E high dose demonstrated infiltration of mononuclear cells (arrow), hypertrophied and edema of portal area (PA). Liver sections of the treated group with azoxystrobin (F–H). F; low dose demonstrated hydropic degeneration (HD). G Medium dose demonstrated infiltration of mononuclear cells (arrow), hypertrophied, and edema of portal area (PA). H High dose demonstrated infiltration of mononuclear cells (arrow), hypertrophied, and edema of portal area (PA). (hematoxylin–eosin (H&E) stained, × 200)

