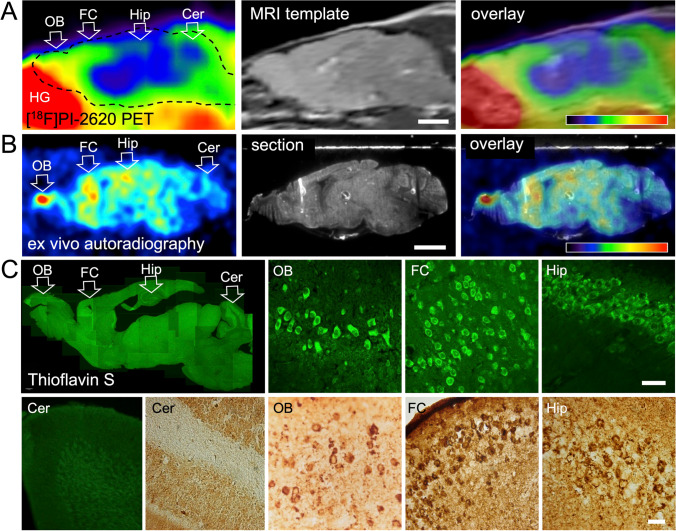
Fig. 1.
Comparison of [18F]PI-2620 PET, ex vivo autoradiography and histology. Shown are sagittal sections of the same mouse (11 months old), rostral = left. (A) [18F]PI-2620 PET, start 8 min after tracer injection, 30-min scan duration. Scale bar: 2.5 mm. Color scale: 0–5 SUVRbg. Tracer accumulation was highest in the olfactory bulb and the frontal cortex. (B) Ex vivo autoradiography of the same animal, start 2 h 15 min after injection, duration 45 min. Smoothing 0.61 mm FWHM. Scale bar: 2.5 mm. Color scale: 0.000–0.0015 cpm. Highest tracer accumulation is visible in the olfactory bulb, frontal cortex, and hippocampus. (C) Histology of the same animal: Thioflavin S staining (green) and PHF1 staining (brown). Scale bars: 30 µm. Tau fibrils are present in the olfactory bulb, frontal cortex, and hippocampus, but absent in the cerebellum. Abbreviations: Cer, cerebellum; FC, frontal cortex; HG, Harderian gland; Hip, hippocampus; OB, olfactory bulb

