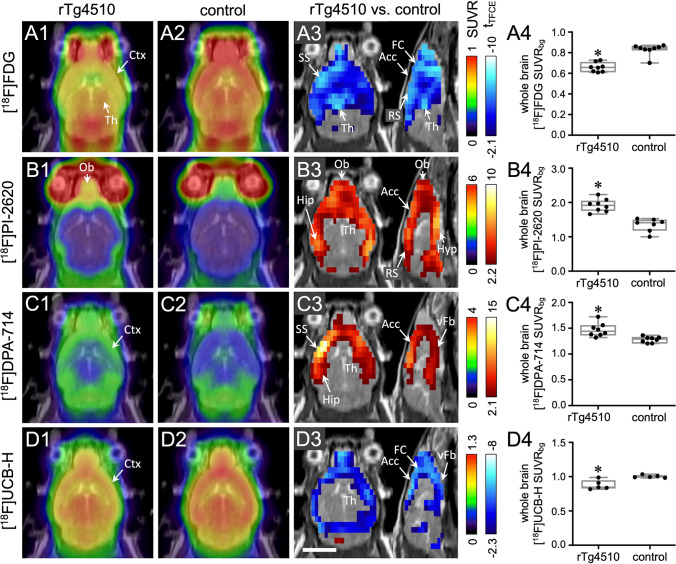
Fig. 2.
Multitracer imaging of rTg4510 mice and non-transgenic littermates (controls). Each row A–D represents a different tracer. Column 1: mean horizontal images of rTg4510 mice (n = 5 to 8). Column 2: mean images of controls (n = 5 to 8). Column 3: voxel-wise comparison between rTg4510 and control mice (t-test, corrected for multiple testing). Red and blue voxels indicate significantly (p < 0.05) higher and lower tracer uptake, respectively, in rTg4510 mice. Column 4: comparison of whole brain tracer uptake (t-test). *t-test, p < 0.05. Scale bar: 5 mm. Abbreviations: Acc, anterior cingulate cortex; Ctx, cortex; FC, frontal cortex; Hip, hippocampus; Hyp, hypothalamus; Ob, olfactory bulb; RS, retrosplenial cortex; SS, somatosensory cortex; Th, thalamus; vFb, ventral forebrain

