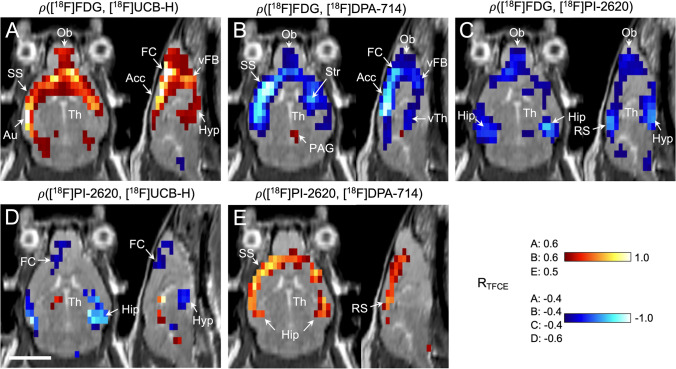
Fig. 3.
Correlation between uptake of different tracers in rTg4510 mice and controls (pooled). Datasets of different tracers were correlated with each other using a Pearson correlation test (significance level p < 0.05, corrected for multiple testing). The resulting correlation maps show for each voxel if the two respective tracers are positively (red) or negatively correlated (blue), or show no relationship at all (gray). The strength of correlation is coded by hue, with light colors reporting strong correlation (R near ± 1) and dark colors indicating weak correlation (R near the significance threshold). The respective significance thresholds are noted on the left side of the color bars, and the brain areas with significant clusters are labeled. [18F]FDG (glucose metabolism) was correlated with (A) [18F]UCB-H (synaptic density), (B) [18F]DPA-714 (TSPO expression), and (C) [18F]PI-2620 (tau deposition). [18F]PI-2620 (tau deposition) was correlated with (D) [18F]UCB-H (synaptic density) and (E) [18F]DPA-714 (TSPO expression). Scale bar: 5 mm. Abbreviations: Acc, anterior cingulate cortex; Au, auditory cortex; FC, frontal cortex; Hip, hippocampus; Hyp, hypothalamus; Ob, olfactory bulb; PAG, periaqueductal gray; RTFCE, correlation coefficient; thresholded with a TFCE procedure [38]; RS, retrosplenial cortex; SS, somatosensory cortex; Str, striatum; Th, thalamus; vFb, ventral forebrain; vTh, ventral thalamus

