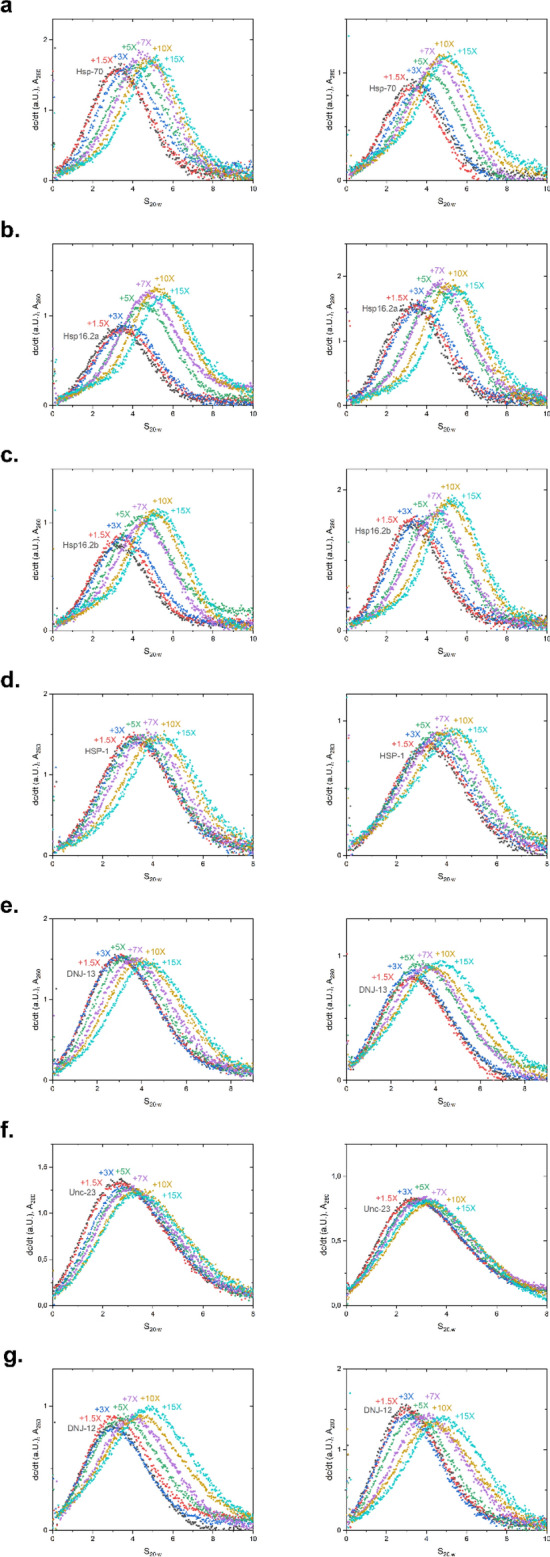
Figure 5.

Analysis of interaction between selected promotors and Hsf-1 DBD via titration in SV-AUC. HSF-1 DBD was titrated to each promoter in concentrations ranging from a 0–15-fold excess. A shift to the right represents DNA-binding by the HSF-1 DBD. dc/dt plots of the absorbance measured at 260 nm (left panel) and at 280 nm (right panel). Respective promoters used: (a) HSP-70; (b) HSP16.2a; (c) HSP16.2 b; (d) HSP-1; (e) DNJ-13; (f) UNC-23; (g) DNJ-12.
