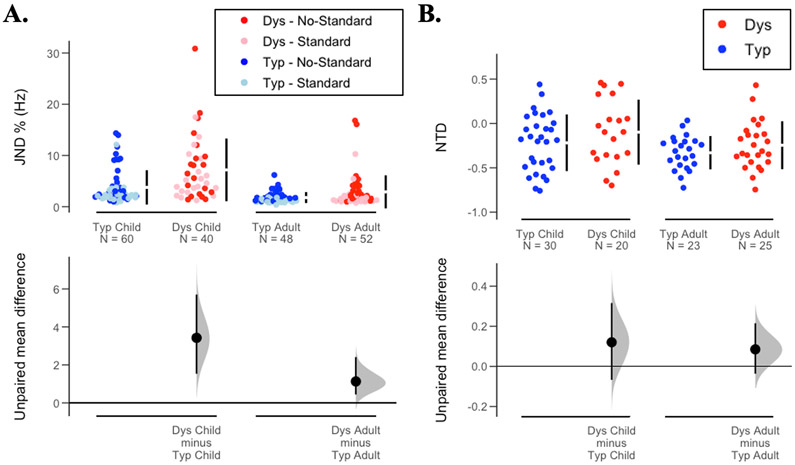
Figure 1:
A. Top: Just noticeable differences (JND) in Hz expressed as percentage of comparison frequency are plotted for four participant groups (blue: typical children and adults; red: children and adults with dyslexia). Overlaid in each plot are the data from the two experimental conditions (dark circles: non-standard (NS) condition; light circles: standard (S) condition). Higher JND values indicate worse tone-frequency discrimination. B. Top: Normalized differences in threshold (NTD) are plotted for the four participant groups. Negative NTD values indicate that the threshold measured for the standard condition is lower than the threshold for the no-standard condition, which indicates anchoring. Bottom: Difference of the means, effect size, and 95% confidence interval.

