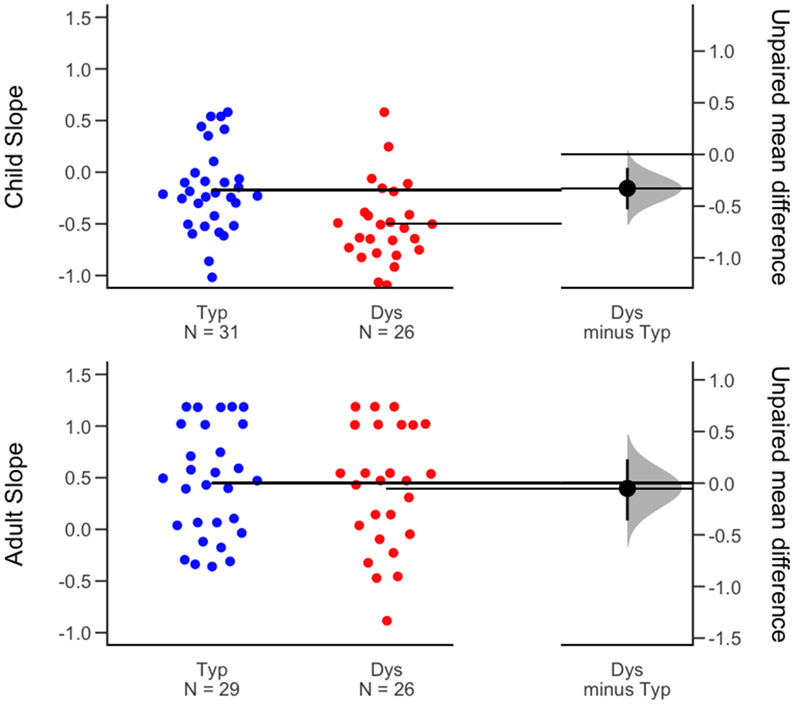
Figure 2:
Log-transformed slopes of the identification functions calculated for the selective adaptation experiment in children (top) and adults (bottom). On the right, estimation plots show the mean differences in slopes between the dyslexia and typical groups (i.e., effect sizes: black dots), mean values for each group indicated by the horizontal bars, the distribution of the effect sizes of the mean differences, and their 95% confidence intervals (black bars).

