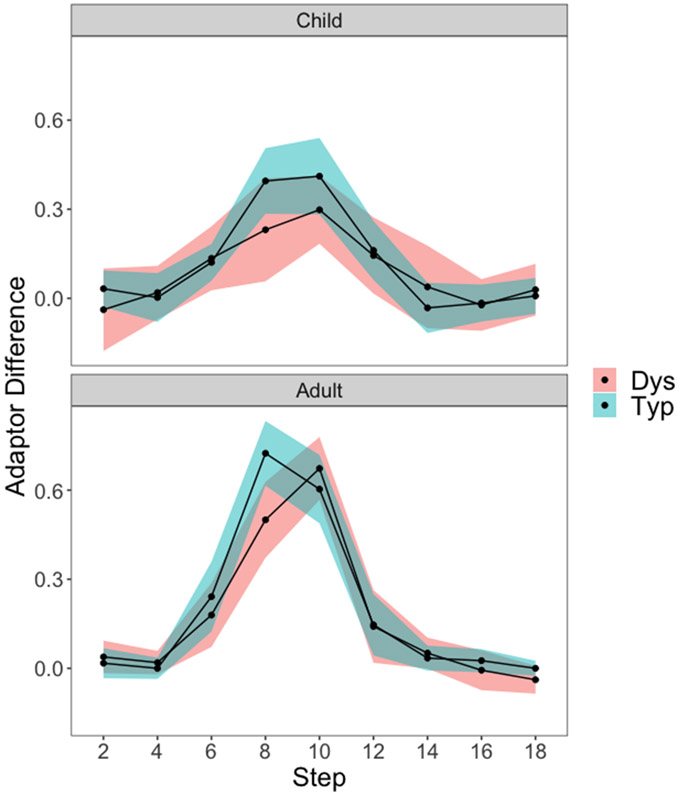
Figure 4:
Speech adaptation effects (proportion of /b/ responses under the /da/ adaptor minus under the /ba/ adaptor) and 95% confidence intervals are plotted as a function of continuum step, for adults (top) and children (bottom), and for individuals with (red) and without (green) dyslexia. At step 8, there is a significant difference in speech adaptation between dyslexia and typical groups in both adults and children.

