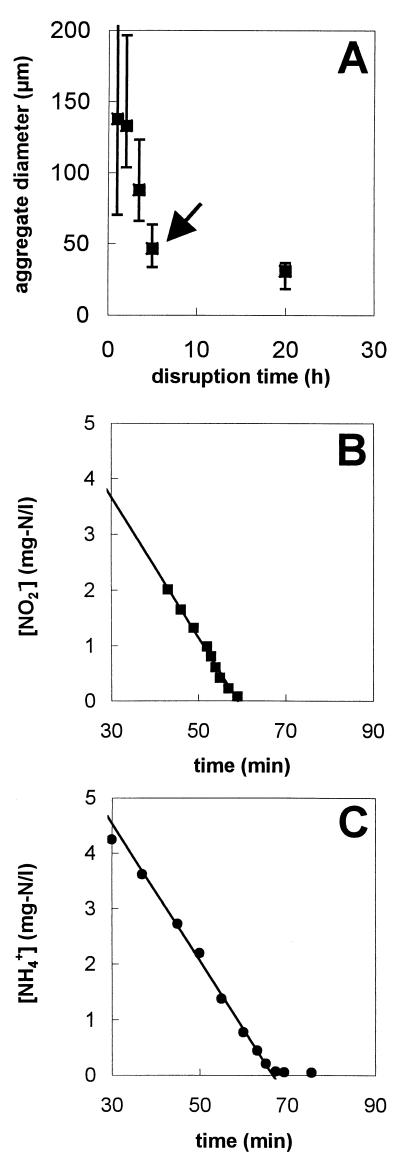
FIG. 1.
Determination of the substrate affinity of the anammox process. Decrease of the aggregate size during the aggregate disruption period (A). Nitrite (B) and ammonium (C) concentrations plotted against time, measured after a 5-h aggregate disruption period (arrow in A). Error bars represent standard deviations.

