
Figure 6. Dominant subclones in tCTCL show deregulation of ribosomal gene expression.
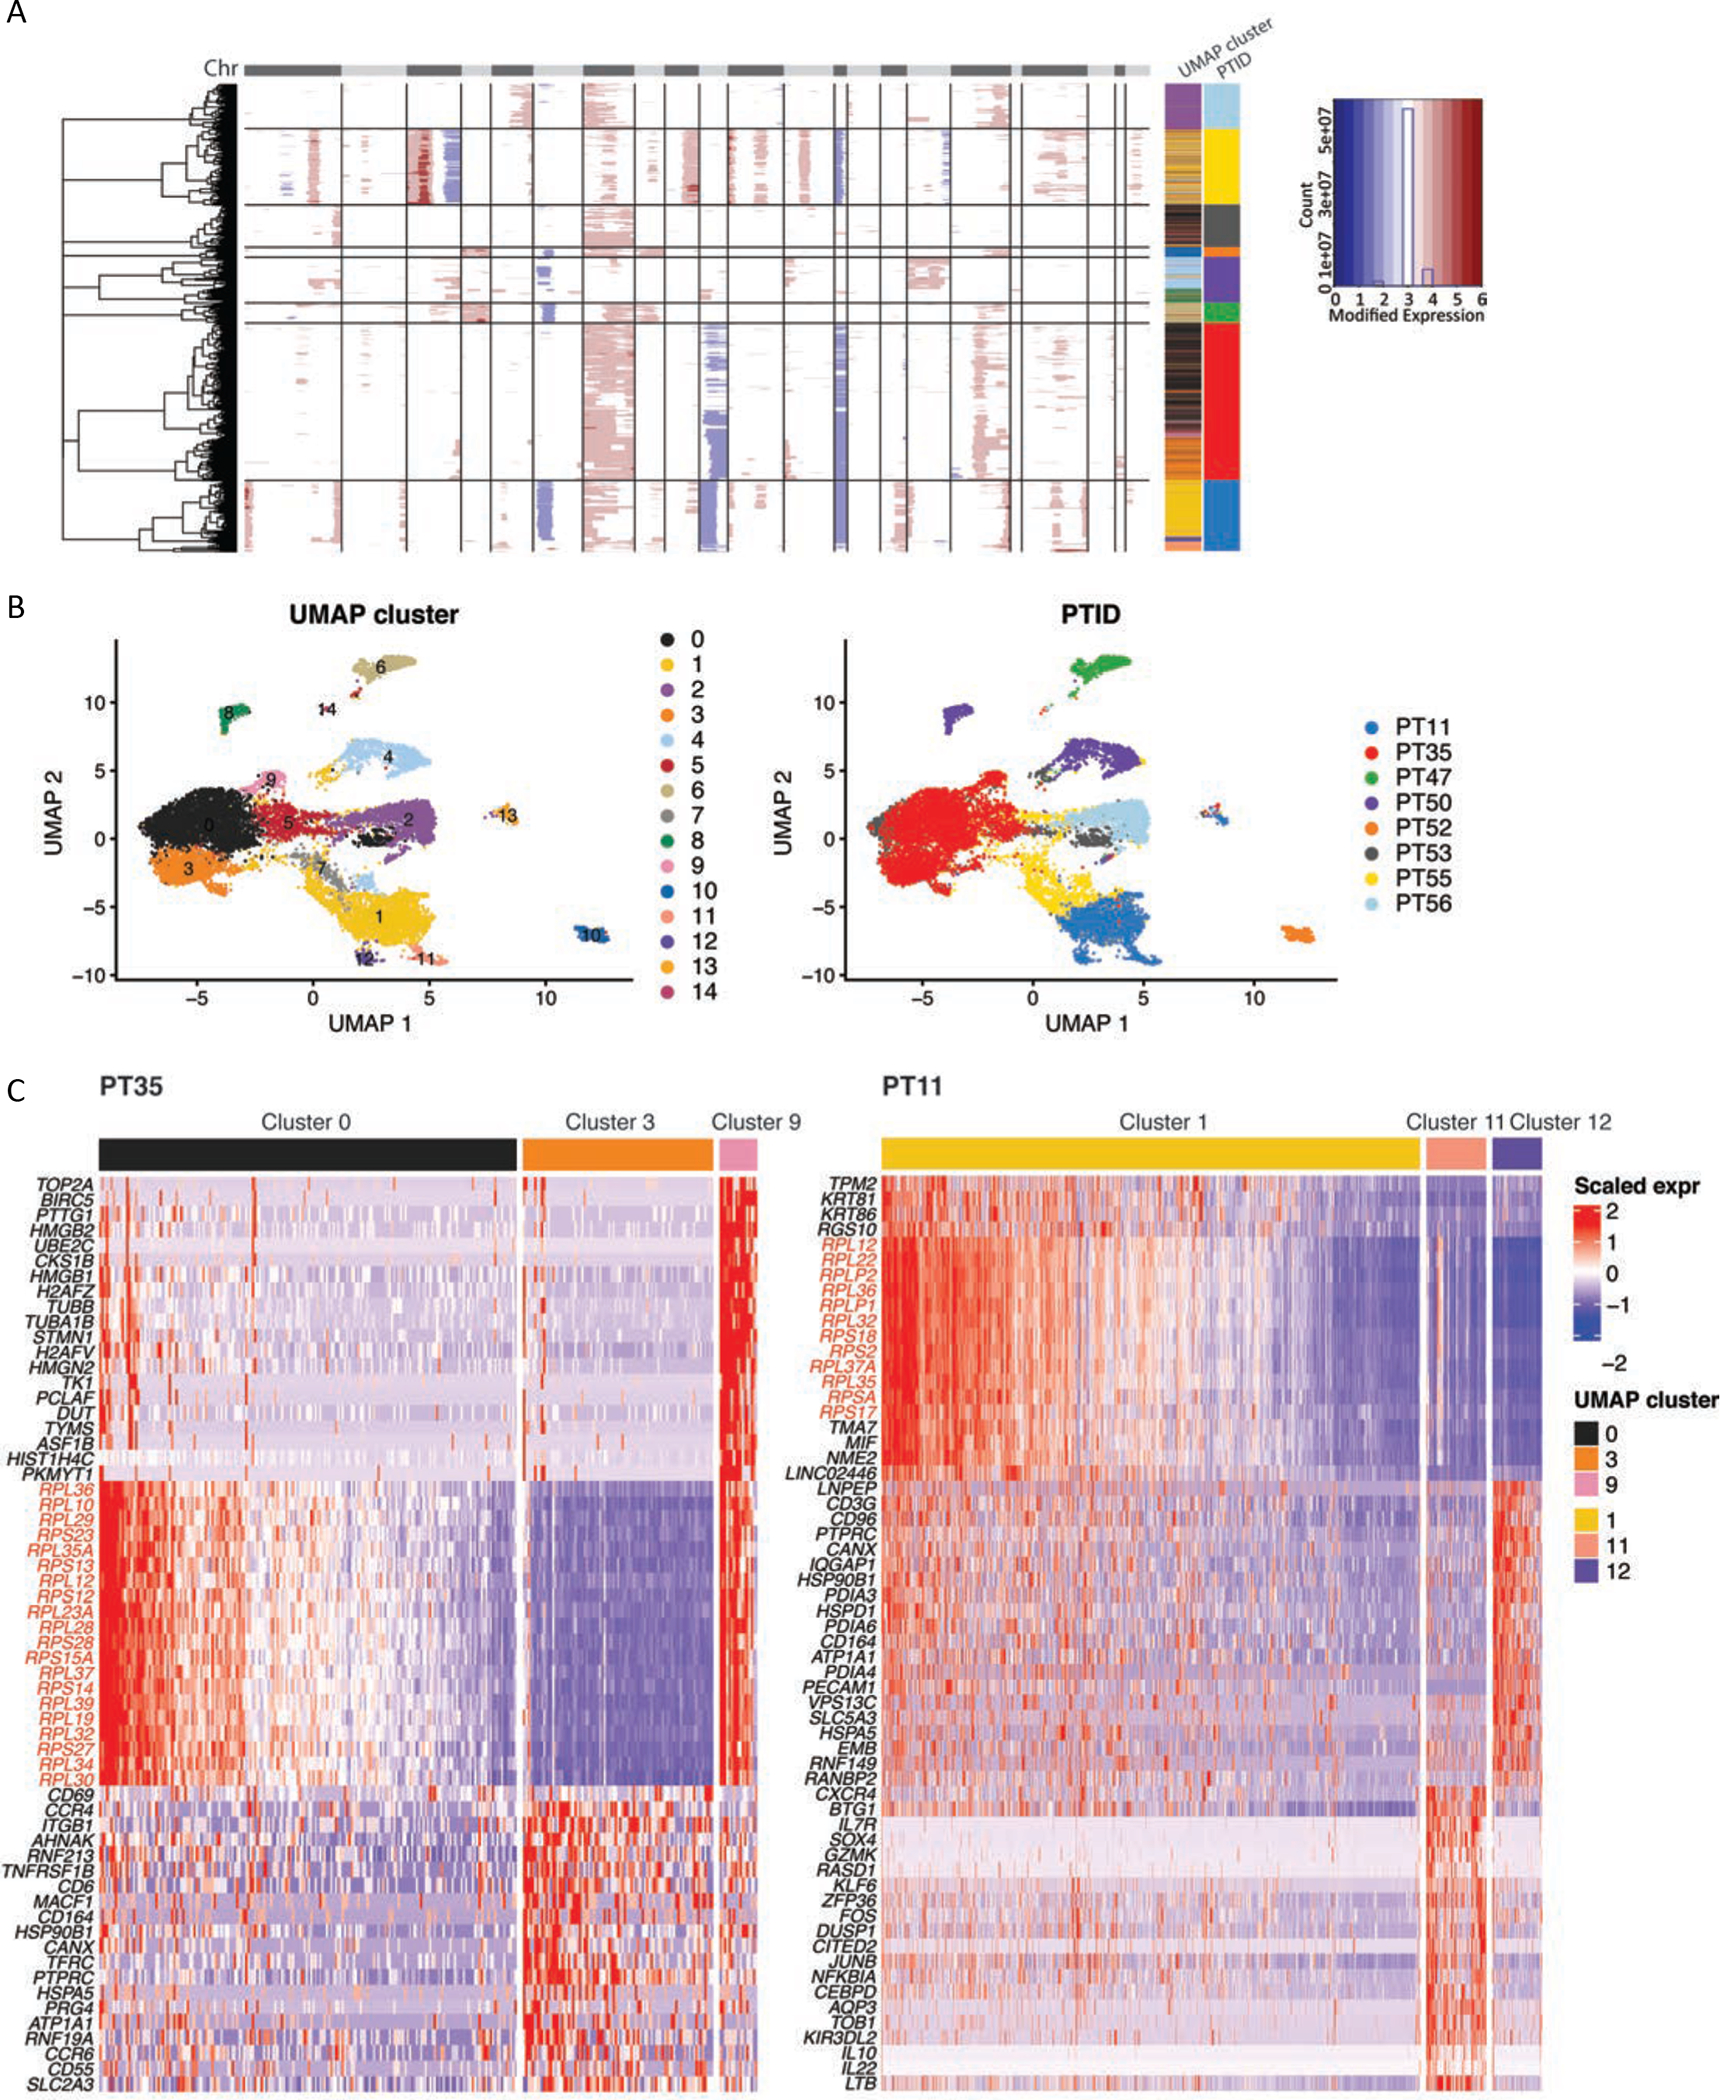
A. Identification of genetic subclones in malignant T-cells in each patient by partitioning hierarchical clustering trees (inferCNV, HMM subcluster mode, “qnorm” method). The CNAs (red, amplifications; blue, deletions) are shown along the chromosomes for each cell. Color bars to the right denote matched UMAP cluster annotation, patient ID and scaled expression.
B. UMAP plots of all malignant T-cells clustered by gene expression (left) and labeled by patient ID (right) reveal subclonal transcriptional heterogeneity in PT11 (clusters 1, 11, 12), PT 35 (clusters 0, 3, 9) and PT50 (clusters 4, 8) (Supplementary Table S17). UMAP clusters and patient IDs (PTID) are color coded to the right. C. DEG of the malignant T-cell subclusters in PT 35 (left) and PT11 (right) reveal dramatic upregulation of genes encoding ribosomal protein large and small subunits in the preponderant malignant T-cell subclones in these two patients with the worst clinical outcomes.