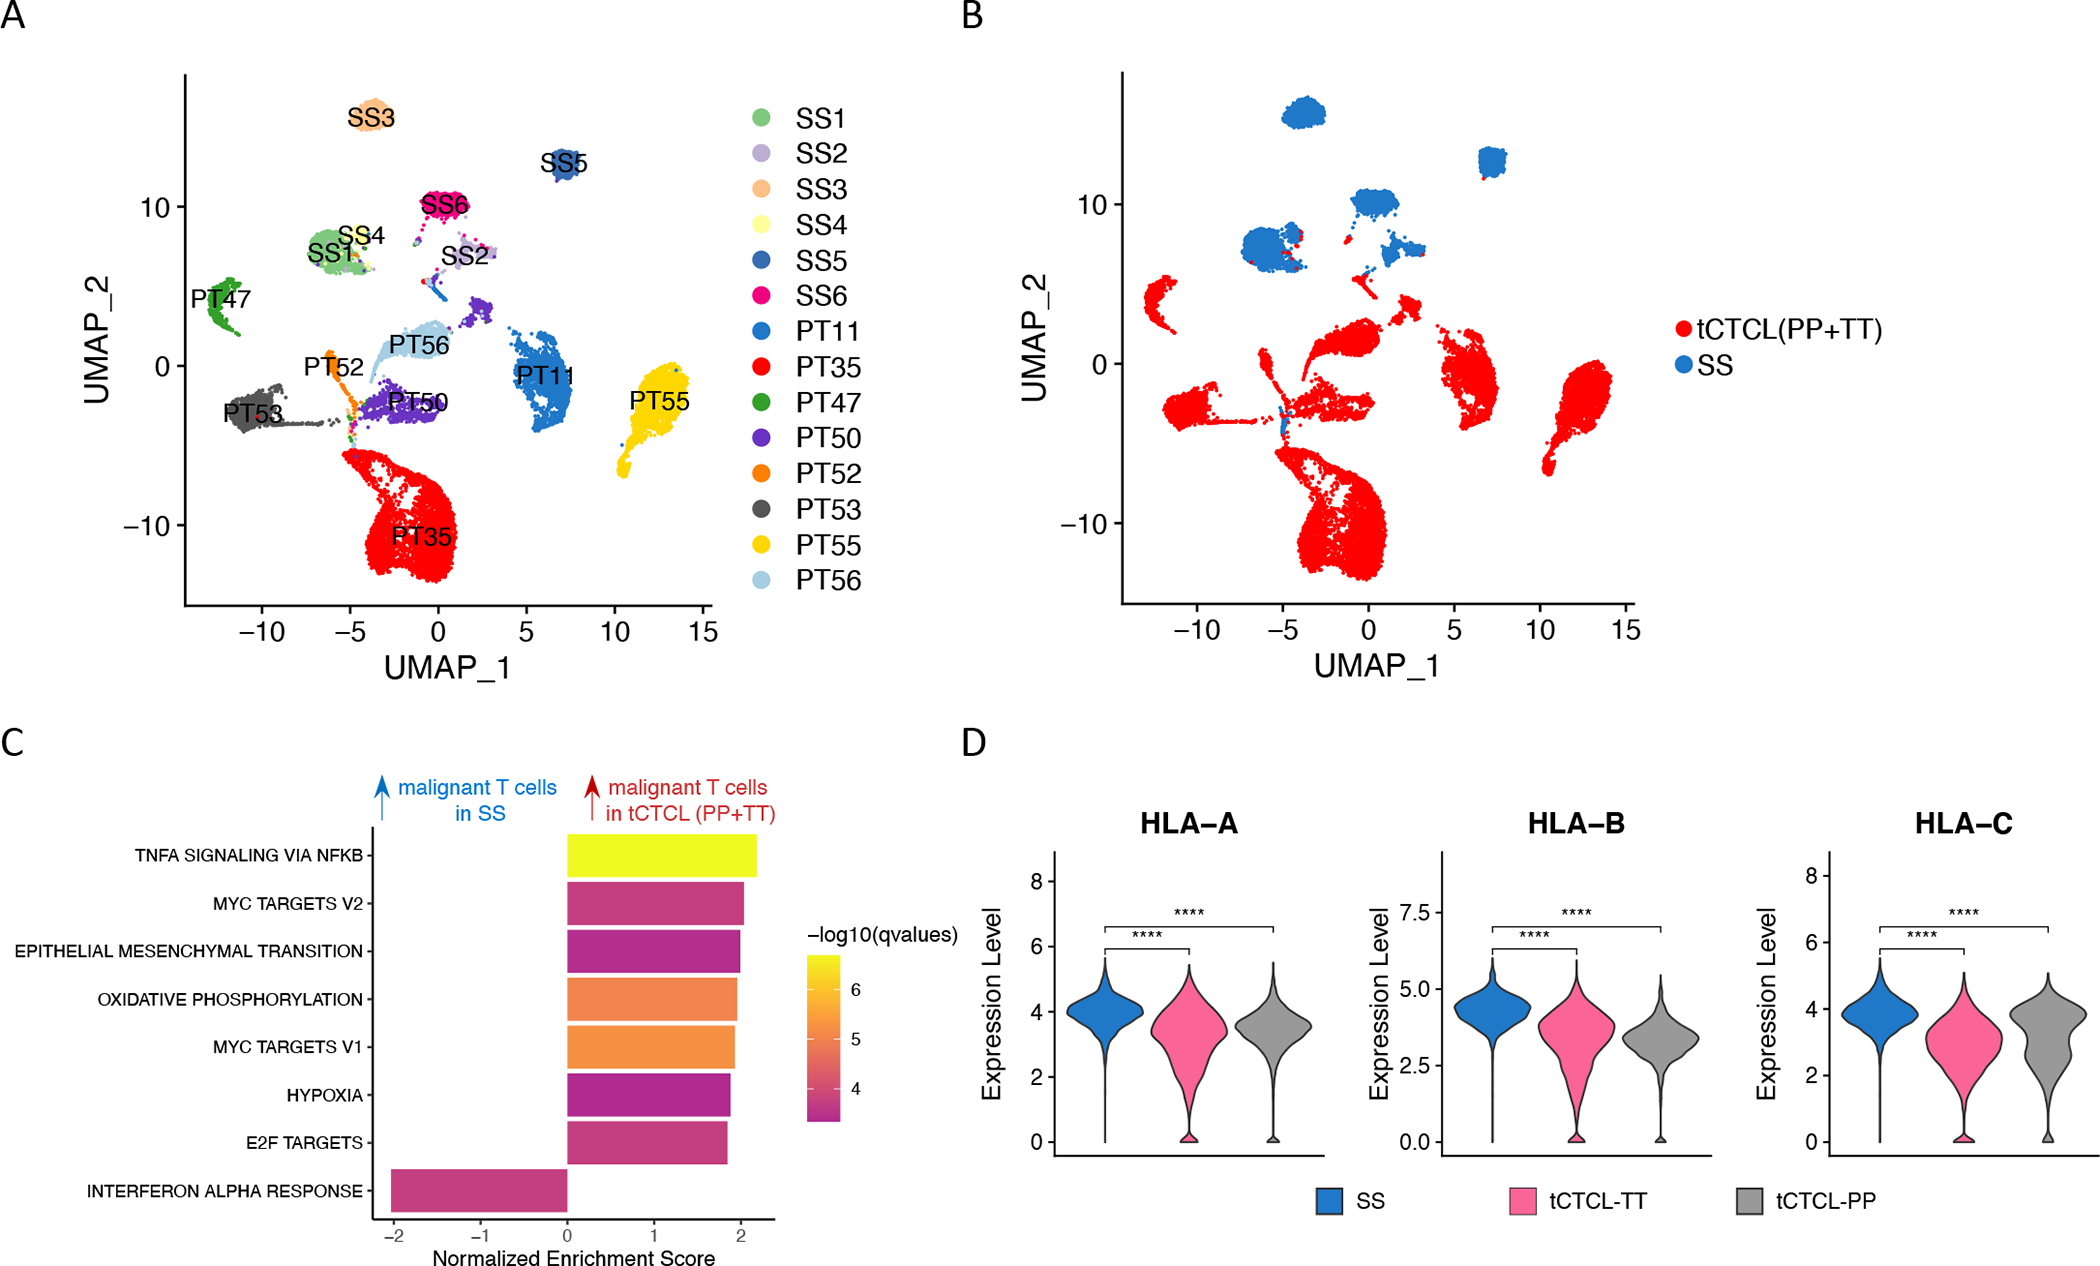
Figure 7. Cutaneous tCTCL shows distinct malignant T-cell oncogenic program from SS.

A. UMAP of malignant T-cells from 6 SS patients (Herrera cohort, patients SS1 to SS6) and malignant T-cells from 8 tCTCL patients in the current study (PT11, 35, 47, 50, 52, 53, 55, 56; each with PP and TT lesions). B. UMAP of malignant T-cells from tCTCL patients (PP+TT, red) and SS patients (blue). C. GSEA comparing malignant T-cells in tCTCL (PP+TT) vs malignant T-cells in SS shows significant upregulation of genes in TNF-a, MYC, EMT, OXPHOS and E2F target pathways and downregulation of genes in the IFN-a pathway. Normalized enrichment score (NES, x-axis). Listed pathways are ranked by their NES and colored by their significance. D. Violin plots of distribution of HLA-A, B, C gene expression (y-axis, normalized expression counts in a log scale) in malignant T-cells in SS (blue), malignant T-cells in TT (magenta) and malignant T-cells in PP (gray). **** denotes p<0.001.
