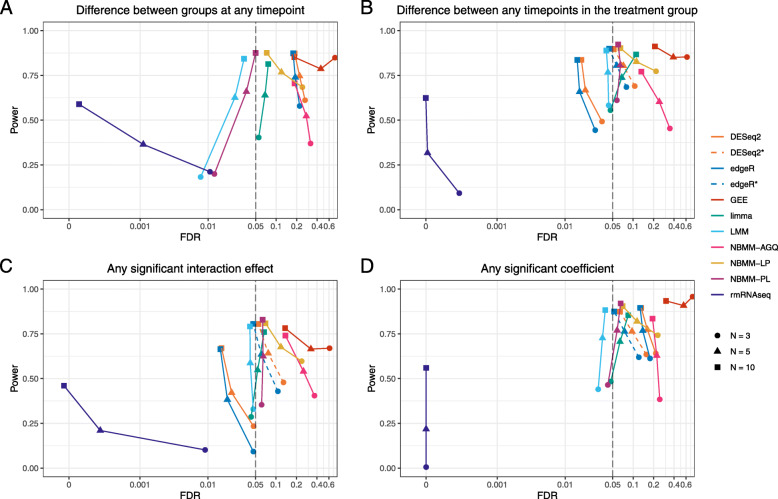
Fig. 2.
FDR versus power across different sample sizes for four tests of interest. FDR and power were calculated using a 0.05 FDR significance level and were averaged across 10 simulations for each method and sample size. Points that lie to the left of the dashed vertical line represent methods that have an observed FDR less than the nominal rate of 5%, while points to the right represent methods with FDR inflation. Points located in the bottom left-hand corner with an FDR and power of 0 represent instances in which no genes were found significant. A log scale is used on the x-axis to better differentiate between methods with close to nominal FDR

