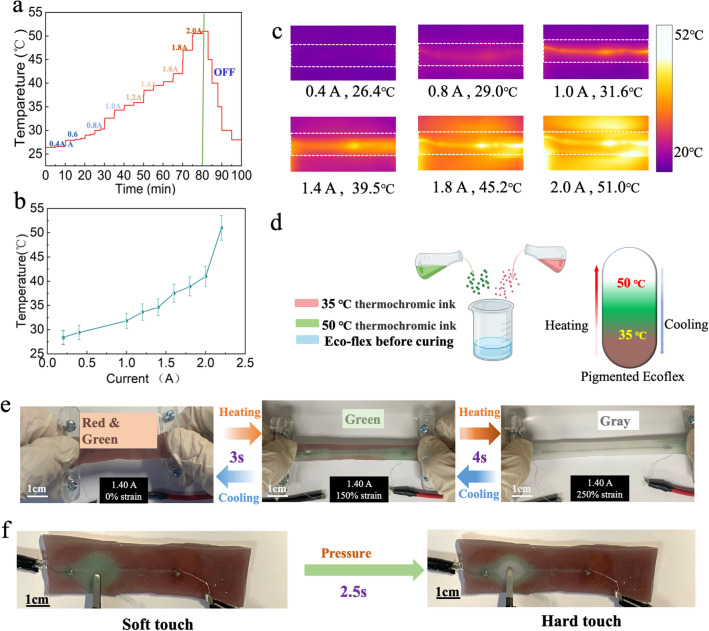
Fig. 4.
The Joule heating properties and application of LM-based thermochromic sensor. a The stepwise temperature changing curve with the applied DC increasing from 0.4A to 2.0 A. b The relationship curve between the applied current and temperature. c The corresponding infrared thermal images of LM circuits. The temperature values represent the average temperatures of the LM line. d Schematic diagram of mixing two thermochromic powders. e Photographs of the color-changing process with the increase of strain level from 0 to 250%. f Photographs of point press leads to color changing between soft touch and hard touch

