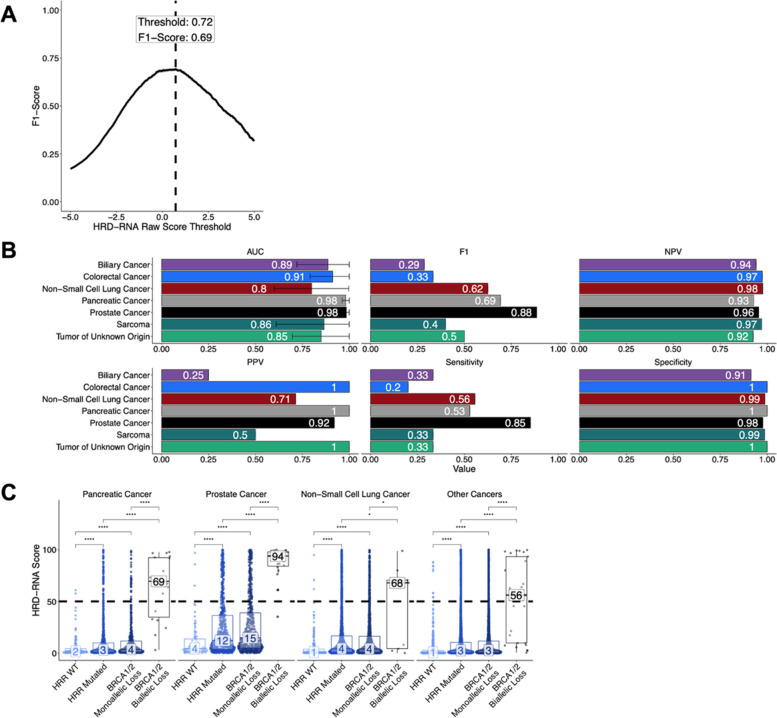
Fig. 3.
The HRD-RNA model determines HRD-status for cancer cohorts outside breast and ovarian cancer using a logistic regression model trained on RNA-seq data. A The threshold for calling a sample HRD+ was set as the raw RNA score that had the maximum F1 score on the training and development samples. For final reporting, the raw score was transformed to the final HRD-RNA, where a score of 50 represents the chosen threshold (Methods). B Metrics used to assess HRD-RNA model performance across cancer cohorts for samples within the evaluation set. C Distribution of HRD-RNA scores across different HRR genotypes in the evaluation set for cancer indications with > 3 BRCA-deficient samples in the evaluation set. Dotted line represents the threshold chosen in (A). Values in the box represent the median HRD-RNA score. Differences determined by Wilcoxon test (* p-value < 0.05, **** p-value < 0.0001). Statistical differences between HRR-WT and BRCA biallelic loss were not shown. Statistical differences between HRR-WT and BRCA biallelic loss were not shown, but all were significant (p-value < 0.0001 for Wilcoxon test). AUC: Area Under the Curve. NPV: Negative Predictive Value

