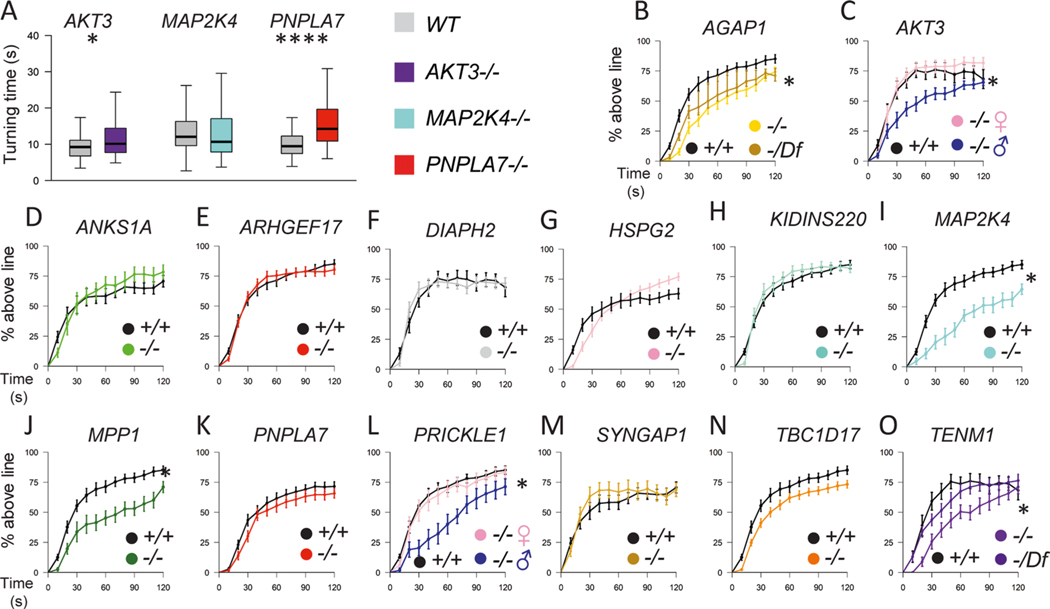
Extended Data Fig. 9 |. Additional locomotor phenotypes of loss of function mutations in Drosophila orthologs of candidate cerebral palsy risk genes.
Drosophila mutant and control genotypes are shown in Supplementary Table 9. a, Turning time, a measure of coordinated movements, is increased in larva with mutations in AKT3 and PNPLA7 orthologs, but not in MAP2K4. b-o, Distance threshold assay examining negative geotaxis climbing defects in for 14 day-old adult flies with mutations in orthologs of AGAP1 (b), AKT3 (c), ANKS1A (d), ARHGEF17 (e), DIAPH2 (f), HSPG2 (g), KIDINS220 (h), MAP2K4 (i), MPP1 (j), PNPLA7 (k), PRICKLE1 (l), SYNGAP1 (m), TBC1D17 (n), and TENM1 (o). Impairments in the climbing assay was detected for males with mutations in AKT3 and PRICKLE1 (c,l) and for both sexes with mutations in MAP2K4 and MPP1 (i,j) orthologs. climbing phenotype mapped to gene using deficiency chromosome for AGAP1 (b), but did not map for TENM1 (o). there was no locomotor impairment in the two negative control genotypes, ARHGEF15 and ANKS1A, where the patient variant did not pass our deleteriousness filters (d). For larval turning, box indicates 75th and 25th percentile with median line; whiskers indicate 10th and 90th percentile (n = 50 larvae). Locomotor curve represents average of all trials and bars indicate standard error (n = 10–21 trials). Statistics between larval turning times determined using unpaired 2-tailed t-test. Locomotor curves considered to be significantly different from each other if P < 0.05 for Kolomogrov-Smirnov test in addition to a significant difference at one or more time bins by Mann-Whitney rank sum 2-tailed test. *P < 0.05, ****P < 1 ×10⁻⁶. exact genotypes, n, and P values are provided in Supplementary Table 9.

