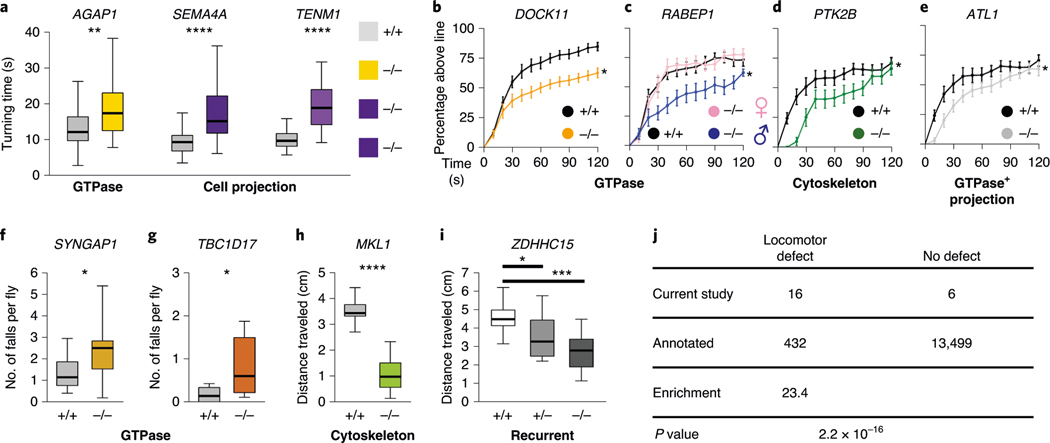
Fig. 4 |. Locomotor phenotypes of LoF mutations in Drosophila orthologs of candidate CP risk genes.
a, Turning time, a measure of coordinated movements, is increased in larvae with mutations in AGAP1, SEMA4A and TENM1 orthologs. Drosophila mutant and control genotypes are provided in Supplementary Table 9. b–i, 14-day-old adult flies have locomotor impairments. b–e, Negative geotaxis climbing defects in distance threshold assays for flies with mutations in orthologs of DOCK11 (b), RABEP1 (c), PTK2B (d) and ATL1 (e). Some genotypes have a male-specific locomotor defect (c). f,g, Increased number of falls for flies with mutations in SYNGAP1 (f) and TBC1D17 (g) orthologs, although the percentage reaching the threshold distance was normal (extended Data Fig. 10). h,i, Impairments in the average distance traveled of flies with mutations in MKL1 (h) and ZDHHC15 (i) orthologs. related GO terms for genes are shown in bold. For the box and whisker plots, the box indicates the 75th and 25th percentiles with a median line, and the whiskers indicate the 10th and 90th percentiles. the locomotor curve represents the average of all trials and the error bars indicate standard error. n = 50 larvae, n = 10–21 trials for falls and distance traveled assays, and n = 10–21 trials for locomotor curves. the differences in larval turning times, distances traveled and numbers of falls were determined by unpaired two-tailed t-tests. the locomotor curves were considered to be significantly different from each other if P < 0.05 for a Kolmogorov–Smirnov test in addition to a significant difference at one or more time bins by a Mann–Whitney rank sum two-tailed test. *P < 0.05, **P < 0.005, ***P < 0.001, ****P < 1 × 10⁻⁶. exact genotypes, n and P values are provided in Supplementary Table 9. j, Enrichment of locomotor phenotypes detected in studies of putative CP genes (observed) compared to genome-wide rates annotated in https://flybase.org (expected, 3.1%). The P value was calculated by Fisher’s exact two-tailed test.

