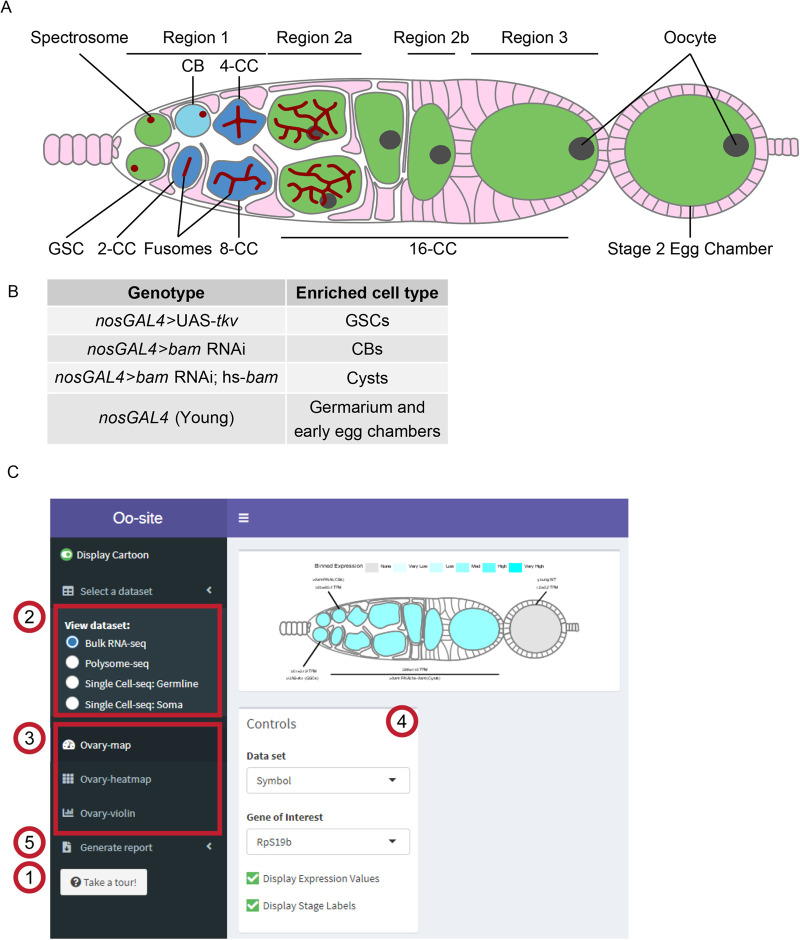
Fig. 1.
Oo-site integrates and provides an interface for interacting with multi-omic data covering major stages of Drosophila GSC differentiation. (A) Schematic illustrating developmental stages of germline development. (B) Summary of the samples used for bulk RNA-seq and polysome-seq and the cell types these samples are enriched for. (C) Screenshot of Oo-site dashboard, indicating: (1) ‘Take a Tour!’ function, which guides the user through the functionality and operation of Oo-site. (2) The available seq datasets, which the user can view, including RNA-seq of ovaries genetically enriched for developmental stages (bulk RNA-seq), polysome-seq of ovaries genetically enriched for developmental stages (Polysome-seq), single-cell seq of germline stages (Single-Cell seq: Germline), and single-cell seq of somatic stages in the germarium (Single-Cell seq: Soma). (3) The available visualizations, which the user can use, including viewing the expression of genes over development at the level of a single gene (Developmental Progression), viewing all significantly changing genes as heatmaps (Heatmap), and viewing groups of genes either derived from GO-term categories or supplied by the user (Gene Groups). (4) The control panel, which the user can use to control the current visualization, and (5) the Generate Report Function, which can be used to download a PDF report of either the current visualization or all active visualizations.

