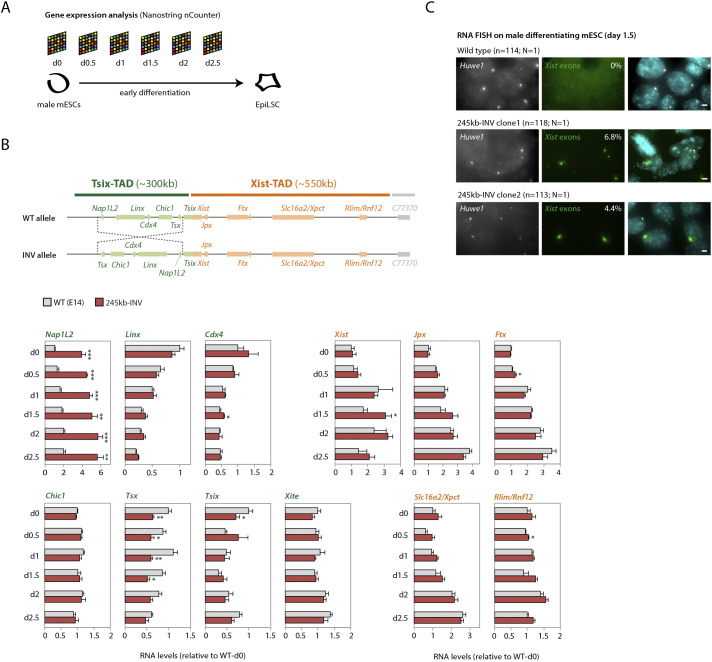
Fig. 3.
Inversion leads to transcriptional changes of specific genes within the TAD and of Xist across the TAD boundary. (A) Schematic of the mESC-to-epiblast-like stem cell (EpiLSC) differentiation and time points analyzed by Nanostring nCounter (see Materials and Methods). (B) Gene expression analysis during differentiation (d0-d2.5). Data are normalized to wt-d0 for each gene, and represent the mean±s.d. of two biological replicates (wild type) or of two independent clones (mutant). Data were analyzed with a two-tailed paired Student's t-test (*P<0.05; **P<0.01; ***P<0.001). (C) RNA FISH for Huwe1 (X-linked gene outside of the Xic) and Xist (exonic probe) on mESCs differentiated to d1.5. The percentage of cells with Xist RNA accumulation is indicated and represents the mean from two independent experiments, where N indicates the number of experiments and n indicates the number of nuclei counted. Scale bars: 2 µm.

